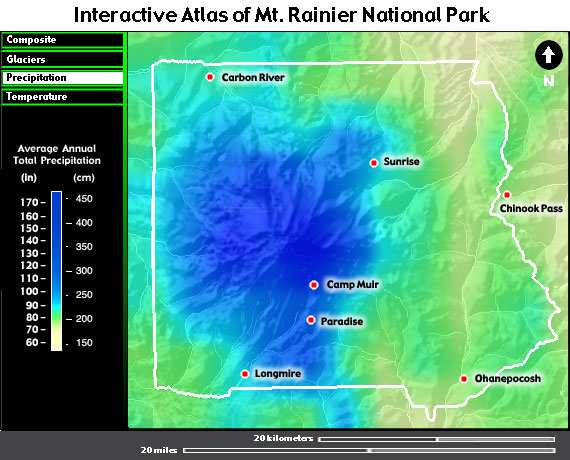
This map shows the average total annual precipitation throughout the National Park. Total annual precipitation is the amount of rain and snow that falls during any given year. Average total annual precipitation is the average of the total annual rain and snow fall for a given period of time. In the case of this map, annual precipitation is averaged for the period 1961 to 1990. The amounts shown by this map are based on records from climate stations located in or around the park (indicated by the red dots). The amounts between the stations are estimates based on values from each station, elevation, and prevailing wind directions (c).
Note: Estimated precipitation was calculated for two kilometer wide cells. Consequently, the original precipitation map was a grid made up of relatively large blocks. To give the map seen above a more "natural look" the original precipitation map was "blurred" using Photoshop, before being laid on top of a relief map of the park.
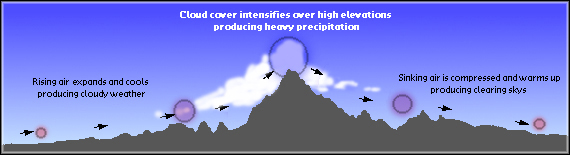
One trend that is obvious from the map is that the wettest area in the park is high on the mountain. Likewise, the climate is wetter on the west side of the park than the east side. This pattern is the result of how storms move through the Pacific Northwest. Generally, in the Pacific Northwest moisture laden air from the Pacific Ocean flows eastward. As this air flows up and over the Cascade Mountains, it expands and cools, resulting in condensation, cloud formation, and precipitation. As the air flows down the east side of the Cascades, it compresses and warms causing clouds to dissipate. You can see all this during clear summer days when a cap of clouds forms on Mount Rainier (c). At such times hikers in alpine meadows will enjoy warm, clear weather, while climbers high on the mountain experience snow storms or cold rain.
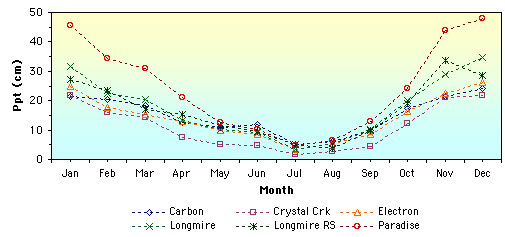
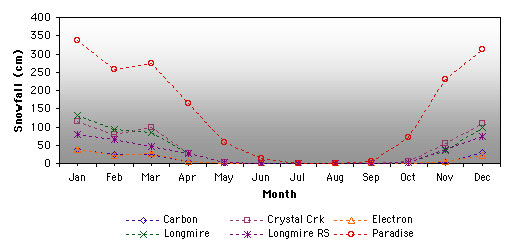
Rain and snow fall has been measured at Mount Rainier since 1931 (c). With three climate stations inside the park boundaries and another three in close proximity, the records of climate conditions are some of the most complete of any national park in the Northwest. The longest running station, Longmire, has a climate record going back over seventy years. All the other stations have continuous records spanning more than fifty years. All six stations have records for both rain and snow fall. Not surprisingly, the higher stations receive more precipitation most of it falling as snow .