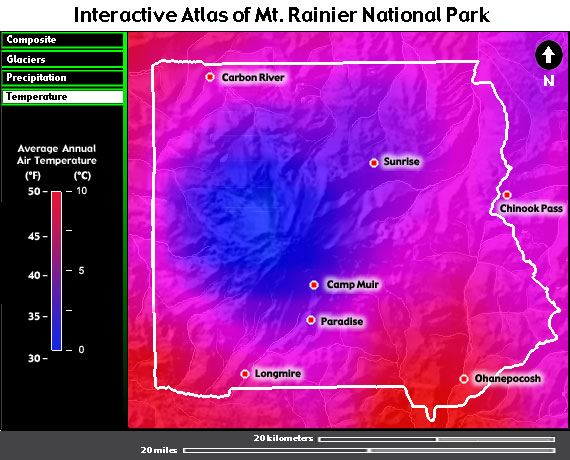
This map shows average annual air temperature throughout the national park. Annual air temperature is an average of daily temperatures for an entire year. Long term average annual air temperature is an average of all the annual average temperatures for a given period of time. For this map annual temperature is averaged for the period 1961 to 1990. The temperatures shown by this map are based on records from climate stations located in or around the park (indicated by red dots). Temperatures between the stations are estimates based on values from each station, elevation, and prevailing wind directions (c).
Note: Air temperature between stations was calculated for two kilometer wide cells. Consequently, the original temperature map was a grid made up of relatively large blocks. To give the map seen above a more "natural look" the original temperature map was "blurred" using Photoshop, before being laid on top of a relief map of the park.
Generally speaking, higher elevations are colder. The explanation for this trend is twofold. First, in the lower atmosphere air temperature drops with altitude, since the atmosphere is being heated from the ground up. Second, as air moves up and over the mountain, it expands and cools causing clouds to form. Not only has rising cooled the air, but the formation of clouds blocks sunlight, causing even colder air temperatures. It is this process which is responsible for the large ice cover on Mount Rainier.
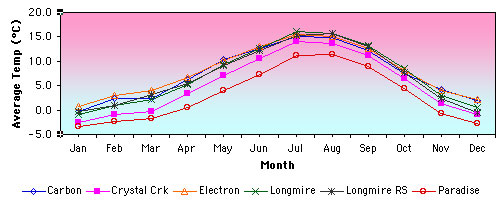
Like precipitation, air temperature in and around the park has been measured since 1931. Figure 1 compares average monthly temperature recorded at each of the stations closest to the mountain. Not surprisingly, the highest station, Paradise, has the lowest average temperature, while lower altitude stations are significantly warmer .