|
In 1994 Mount Rainier's glaciers had a combined area of 90 square kilometers ( 35 square miles), and an estimated total volume of 4.2 cubic kilometers ( 1.0 cubic miles). Between 1913 and 1994, the combined area dropped by 21% and total volume by 25%. In general, glaciers on the south side of the mountain shrank more than glaciers on the north side (total area losses of 27% and 17% respectively). The changing position of glacier termini indicate that all of the mountain's major glaciers retreated between 1913 and the late 1950's, then advanced until the early 1980's, and then retreated significantly during the 1990's (c).
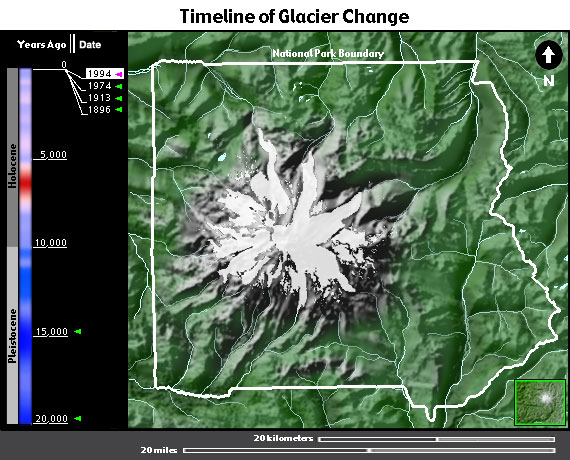
Description of the time line bar on the left side of the map
The lower division of the time line, the Pleistocene, actually extends from 1.6 million to 10,000 years. It is a period of time during which several global ice ages occurred. You can see how Mount Rainier and its surroundings might have looked during the late Pleistocene by clicking on 15,000 or 20,000 years ago. The upper division, the Holocene, is period of a global warming, during which time the world's glaciers have retreated and sea level has risen. To see how Mount Rainier's glaciers changed during the late Holocene, click on 1896, 1913,1974, or 1994. The red and blue bar next to the Holocene and Pleistocene bars show average global temperature during the past 20,000 years. The dark and medium blue bands show periods of global cooling. The red and pink bands show periods of global warming. Dark blue is coldest and bright red is warmest (c).
To look at the area surrounding Mount Rainier, click on the small map in the lower right hand corner of the map.
|