| . |
.
Glacier Research on Mount Rainier
Techniques for studying glacier change
Glaciers often appear static to the casual observer, but in fact they advance or retreat in dramatic ways compared to other geologic events. Various ways exist to measure glacial changes. One approach is to measure changes in their length and area. This has been a traditional method dating from at least the 1800’s and perhaps earlier. Other methods estimate changes in volume, or mass. Also, the rate of glacier movement can be measured. The choice of which method or combination methods depend on the question being asked, resources available and tools in hand. Both the National Park Service and the U.S. Geological survey have made systematic measurements of Mt. Rainier’s glaciers since the late 1890's, making it one of the longest and most detailed records of glacier change in the United States
1) Mapping the terminus of glaciers
Perhaps the easiest approach to monitoring glacier change is to record the position of a glacier terminus. The distance to the ice front from a fixed position is the most common method. With the advent of global position system instruments, a locally fixed position may not be required. Also, repeated photography, whether aerial, satellite, or ground-based is another common method. Neighboring bedrock features provide fixed references to scale the image (c). Several glaciers on Mt. Rainier have photographic records that extend back over a century (c).
|
|
Figure 1 - The lower portion of Nisqually Glacier, July 2001. The white outline shows the current location of the glacier terminus. The red area shows the terminus of the glacier in 1912 (based on a photograph taken by Aashel Curtis). The estimated retreat is 1.5 kilometers (0.9 miles). |
2) Determining glacier characteristics using remote imaging and digital mapping technology.
Because of the difficulty and expense of traveling to and on glaciers, often glaciers are mapped using air photos and/or satellite images. Such images large areas of remote regions without the cost and time required for ground mapping (c). Furthermore, advances in digital processing technology have greatly reduced the time required to interpret the imagery and provided products that can rapidly be rescaled to meet a variety of needs. . Combining these images with digitized historical maps yield a history of change in glacier length, area, debris cover, etc.
|
|
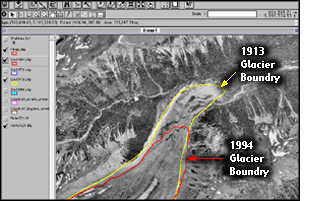
Figure 2 - A map of Emmons Glacier produced using geographic information system software, digitized glacier outlines for 1913 and 1994, and a digital orthoquad. |
3) Determining glacier volume
Glacier volume is an important attribute because glaciers are frozen reservoirs of water and are important to water resource planning. However, the remote location and size of many glaciers challenge attempts to accurately determine glacier volume. One method measures ice thickness using ice-penetrating radar, which is a portable radar transmitter / receiver that can be towed or carried across the glacier’s surface. As the unit travels over the surface, it emits a radar pulse that passes through the snow and ice until it reflected by various impurities in the ice or the base of a glacier back to the receiver. The ice thickness is calculated using the speed of the radar wave and total travel time to and from the unit. From the thickness map, the volume of the glacier can be calculated (c).
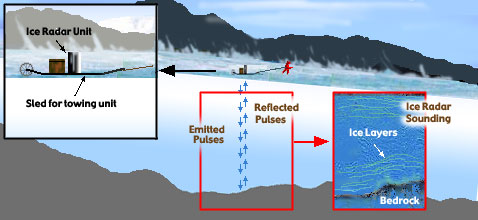
Figure 3 - Operation of Ice Penetrating Radar
While such ground surveys produce relatively accurate measurements of glacier thickness and volume, they tend to be expensive and time-consuming. Furthermore, radar surveys are difficult in steep and crevassed glacier surfaces. Aerial surveys are possible, but they too are challenging on steep glaciers.
One alternative is to estimate glacier volume from its surface area, which can be measured remotely. Based on known glacier volumes, measured by radar surveys, mathematical relations have been developed that relate glacier volume to its area. While this method is imprecise compared to radar methods, it does provide a reasonable way to estimate glacier volume for many glaciers distributed over a broad region (c).
4) Monitoring glacier motion
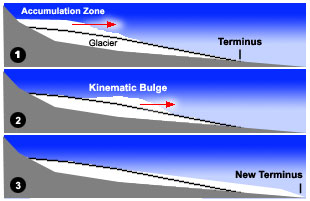
On Mount Rainier, elevation surveys of Nisqually Glacier are regularly made to determine changes in the elevation of the surface. Through these surveys "bulges" have been tracked as they travel down the glacier (c). These bulges, called kinematic waves, form when higher than normal snowfall builds up in the accumulation area of the glacier (c). As the bulge grows, it begins to move down the slope, faster than the glacier ice itself. When it reaches the bottom of the glacier, the terminus advances drammatically. A time delay exists between changes in snowfall, and the glacier advance because of the time required for the kinematic wave to move down glacier. Understanding kinematic waves is an important process to consider when assessing glacier response to climate change.
|
|
Figure 4 - Time lapse diagram showing the development and movement of a Kinematic wave in a glacier.
|
5) Measuring mass balance
Mass balance measurements quantify the mass changes of a glacier. This is the most direct measure between climate and glacier response. The climate usually determines the mass change of a glacier. Winter snow accumulation adds mass to the glacier and summer melt takes mass away. The volume of a glacier over a year’s time may be constant, yet the glacier in the accumulation zone gains mass and loses mass in the ablation zone. Thus, on a yearly basis, mass balance measurements will indicate how much melt water is produced, whereas volume measurements will not. Glacier advance and retreat (area change) are the result of long-term (10 years) climatic change because of the delay imposed by glacier dynamics. Thus, mass balance measurements track the most direct and immediate response of a glacier to changes in the meteorological environment.
Currently, there is no long term mass balance data for Mount Rainier, a problem that the National Park Service is attempting to rectify when it instituted a regular mass balance program beginning in 2001(c).
|
|
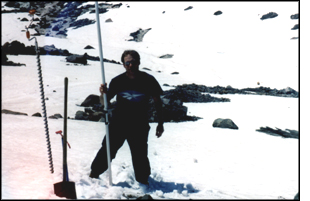
Figure 5 - Portland State University graduate student Thomas Nylen placing an ablation stake in Nisqually Glacier. |
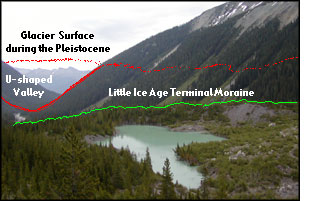
6) Determining the extent of ancient glaciers using post-glacial landforms
As explained earlier, glaciers modify the landscape. After the ice has disappeared we can use these features to infer the former glacier position. For instance, when a glacier occupies a stream valley it deepens and widens the valley. When glaciers recede valleys have a characteristic U-shape. Likewise, as glaciers retreat they often leave behind moraines. The date of the moraines can sometimes be inferred from the age of trees or lichens growing on moraines (c).
|
|
Figure 6 - Evidence for previous position of Emmons Glacier. The abrupt change in the slope of the valley wall marks the top of the glacier more than 10,000 years ago (the Pleistocene). The ridge bordering the lake is a terminal moraine showing where Emmons glacier terminated during the "Little Ice Age" ( 250 years ago). |
A time line of glacier research on Mount Rainier
1857 - A team lead by August Kautz describes the location of the terminus while climbing Mt. Rainier (c).
1870 - Geologists S. Emmons and A. Wilson collect information about the geology and position of glaciers while climbing to the summit of Mount Rainier (c).
1896 - Geologists G. Smith, B. Willis, and glacial geologist I.C. Russell are sent by the U.S. Geological Survey "explore the region... and determine the nature and behavior of the glaciers" on Mt. Rainier. Russell writes a detailed narrative of the glacial geology he observed on the trip to summit. He also suggested that Nisqually glacier be studied on a regular basis by setting up photo stations along the glacier, mapping the terminus of the glacier, and making measurements of glacier flow rates (c).
1905 - University of California geologist J. LeConte made measurements of Nisqually Glacier's flow rate (c).
1913 - F. Matthes (U.S.Geological Survey) creates a topographic map of Mount Rainier, producing the first accurate depiction of glacier location and size (c).
1930's - The National Park Service under the supervision of Schmoe, Bender, Brockman, and others make regular measurement of the terminus of some glaciers on Mount Rainier (c). See Mapping the terminus of glaciers for more information.
1931 - Tacoma City Light Department and the U.S. Geological Survey initiated measurements of surface elevation along profiles across Nisqually Glacier (c). See Monitoring glacier motion for more information.
1950's to present day - A. Harrison, F. Veatch, and others established photo stations near Nisqually Glacier (c). See Mapping the terminus of glaciers for more information.
1960's / 1970's - Kiver and others map ices caves in the glaciers of Mount Rainier (c). Steven Hodge measures velocity and surface elevation on several glaciers (c). Austin Post and Carolyn Driedger (U.S. Geological Survey) map historical terminus positions.
1970's/1980's - D. Crandell and R. Miller (c) investigate the Pleistocene glacial geology of Mt. Rainier. Their work is supported by that of R. Sigafoos and E. Hendricks (c) who made age determinations on moraines using tree-ring dating, and that of Steven Porter and D. Burbank (c) who made moraine age determinations using lichen dating. See Determining the extent of ancient glaciers using post-glacial landforms for more information. Paul Kennard and Carolyn Driedger (c) (U.S. Geological Survey) determine the thickness of glaciers on Mt. Rainier and several other mountains in the Cascade range. See Determining glacier volume for more information.
1990's - Jeremy Mennis (c) (Portland State University) creates a GIS database describing recent changes in the glaciers of Mount Rainier. Thomas Nylen (c) (also of PSU) extends this database pushing the glacial record back to 1896. See Determining glacier characteristics using remote imaging and digital mapping technology for more information.
2000 - The National Park Service has initiated a long-term monitoring program for the Nisqually and Emmons glaciers. Surface elevation measurements are obtained annually on the Nisqually glacier. Mass balance measurements were intiated in 2001 on the Nisqually and Emmons glaciers.
|
|
, |
|