

|
|
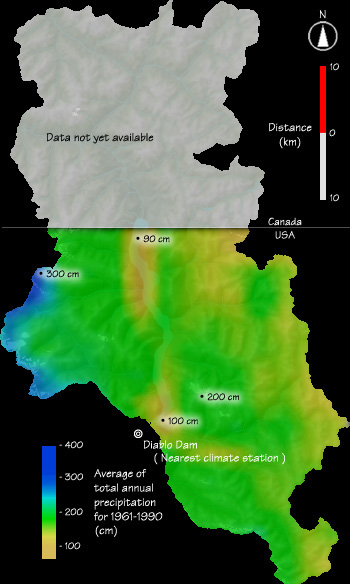
This map shows the 1961-1990 average annual precipitation for the Upper Skagit Basin south of the international border. The map was creating using PRISM data from Oregon Climate Center. The map stops at the international border since no similar data are available for British Columbia. PRISM precipitation data are estimates of average total precipitation (annual rain and snowfall) for points evenly distributed over an area based on precipitation data from individual weather stations and topographic elevation. (c) For instance, estimated precipitation in the Upper Skagit is based on records from Diablo Dam and several other low altitude climate stations. Since the North Cascades acts as a rain shadow that intercepts moist air coming from the Pacific, a digital map of elevation is used in conjunction with climate station data to estimate precipitation for the area between stations. The map on your left shows that the heaviest precipitation occurs at the highest elevations on the western side of the basin. The map also shows a noticeable rain shadow along the eastern edge of the basin where precipitation is at its lowest. Storms come from the west. |