|
DOWNSTREAM EFFECTS OF GLACIERS ON STREAM WATER QUALITY—Does glacier size influence downstream extent? |
|
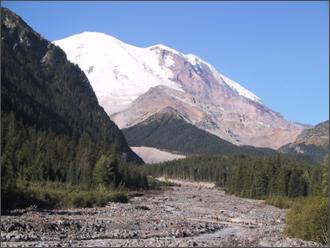
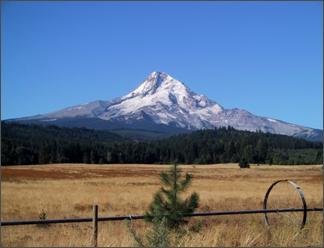
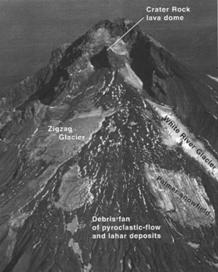
Mount Rainier, Washington, (4,392m, left) has very large glaciers for the Pacific Northwest, while Mount Hood, Oregon, (3,426m, right) supports smaller glaciers. |
|
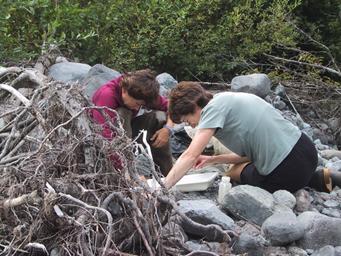
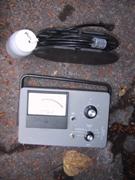
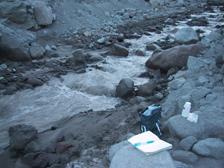
Sampling methods LaGrangian sampling: I hiked to the sample location closest to the glacier and then hiked and drove to each downstream location in an attempt to see how a parcel of water changed as it flowed downstream. I validated the method by estimating water travel time using the Manning equation. Sampling worked pretty well closer to the glacier, but not so well farther downstream. Synoptic sampling: Four people sampled hourly at different locations along each stream for up to 24 hours to see how water quality changed over time at fixed locations. Hobo temperature data loggers: These data loggers collected temperature information in 15-minute intervals at multiple locations along each stream for several days each. Macroinvertebrate sampling: Two macroinvertebrate experts, Jean Jacoby and Joy Michaud, sampled for macroinvertebrates at three locations near Emmons Glacier on White River, Mount Rainier. Jean identified these samples and samples I sent to her from Mount Hood. What was sampled: LaGrangian sampling: temperature, conductivity, suspended sediment, turbidity, nutrients, major anions Synoptic sampling: temperature, conductivity, suspended sediment, turbidity Hobo loggers collected temperature at 15-minute intervals, and macroinvertebrate sampling was done to determine the extent of kryal habitat (glacial at <4°C). Nutrient sampling was also used to investigate kryal habitat.
|
|
What I really want to know is this:
If glaciers are shrinking, what happens to glacial streams?
Will glacial stream habitats shrink, too? Is there any way to predict the extent of glacial stream water quality for glacial streams from glaciers of different size?
Photo: south flank of Mt Hood, in W.E. Scott et al. 1997 Volcano Hazards in the Mount Hood Region, Oregon, USGS Open File Report 97-89
|
|
Matt Hoffman and Andrew G. Fountain came up with an idea for normalizing stream distance from a glacier by dividing by the square root of the glacier area. This results in a unitless index, L* that could be thought of as glacier lengths if glaciers were square. In this plot of points along my study streams, you can see that the fraction of the basin covered by glaciers decreases rapidly until 5 to10 L*, then decreases more gradually from there. The question this prompted was:
Can the rate of change in fractional glacier cover with distance from a glacier in terms of L* serve as a model for downstream change in water quality due to dilution by non-glacial sources? |
|
Methods |
|
Results |
|
Temperature scales with glacier size. The legend lists rivers in order of decreasing glacier size, and curves for water from larger glaciers are shifted to colder temperatures that persist farther.
Regression, correlation, and graphical analyses show that L* and fractional glacierization are better predictors of downstream temperature. |
|
Change in fractional glacier cover with L* is a useful model for downstream temperature change. This plot of maximum temperature has the temperature scale reversed to show you the similarity between these temperature trends and the plot of fraction covered by glaciers against L*. The y-axis value changes rapidly in both until about 10 L*, after which change is gradual. The graph does not show values out to 100 L*, all of which are less than 20 °C. |
|
Turbidity and suspended sediment concentration do not scale with glacier size, nor do they diminish in a way that follows the model of decreasing fractional glacier cover with increasing L*. Rather than consistently decreasing in the downstream direction, turbidity sometimes increased as streams degraded and sediment was picked up from channel surfaces, then increased when sediment settled out. These variables correlated better with distance and distance explained more of the variation. |
|
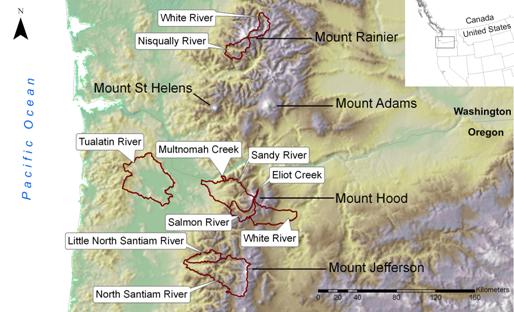
Study Areas |
|
Glacial rivers: White, Mt. Rainier Nisqually, Mt. Rainier Eliot branch Hood, Mt. Hood Sandy, Mt. Hood White, Mt. Hood Salmon, Mt Hood North Santiam, Mt Jefferson (one point)
Non-glacial Multnomah Creek Gales Creek/Tualatin Opal Creek/Little North Santiam
|
|
Specific conductance did not scale with glacier size. Near large glaciers conductivity was greater than near small ones (right– conductivity scale is reversed), which probably reflects a larger proportion of subglacial water as opposed to direct melt (Collins, 1979). The average point at which rapid decline gives way to more gradual decline varies from about 5 to 22 L*, rather than about 10 L* as predicted. |
|
Conductivity trends along the Sandy River were opposite others, starting high close to the glacier until about 9 L* and decreasing with distance. Conductivity from two sets of LaGrangian samples is shown at left with sulfate concentration, which was about 20 times higher than in any other glacial stream. Sandy Glacier rests on the remains of Sandy Glacier volcano, which is older than Mount Hood. (~3.2 – 1.3 million years versus ~0.73 million to near present for Mount Hood. Thouret 2005, Wood and Keinle 1990.) |
|
Chloride concentration was sampled because Palmer Snowfield is salted for summer skiing. Since chloride is a conservative tracer, downstream change in concentration should reflect dilution. It appears, however, that the main natural drainage from the area may not be the primary drainage. Conductivity and chloride concentration increase (with smaller tributaries?) until 16—22 L*. |
|
Conclusions |
|
Can the rate of change in fractional glacier cover with distance from a glacier in terms of L* serve as a model for downstream change in water quality? - Yes, at least in terms of temperature. Below is a plot of maximum temperature (color) is plotted together with the fraction of the upstream basin’s glacier cover (in gray) both against L*. The trend of the general curve is the same. Other water quality characteristics do not follow this model. |
|
References |
|
Scott, W. E., Pierson, T. C., Schilling, S. P., Costa, J. E., Gardner, C. A., Vallance, J. W., Major, J. J. 1997. Volcano hazards in the Mount Hood region, Oregon, U. S. Geological Survey Open File Report 97-89. Thouret, J. C. 2005. The stratigraphy, depositional processes, and environment of the late Pleistocene Pollalie-period deposits at Mount Hood Volcano, Oregon, USA, Geomorphology, vol. 70, pp. 12-32. Wood and Kienle, 1990, Volcanoes of North America: United States and Canada: Cambridge University Press, 354p., p.148-149. |
|
|