|
Steve WilsonM.S. Student |

|
Steve WilsonM.S. Student |
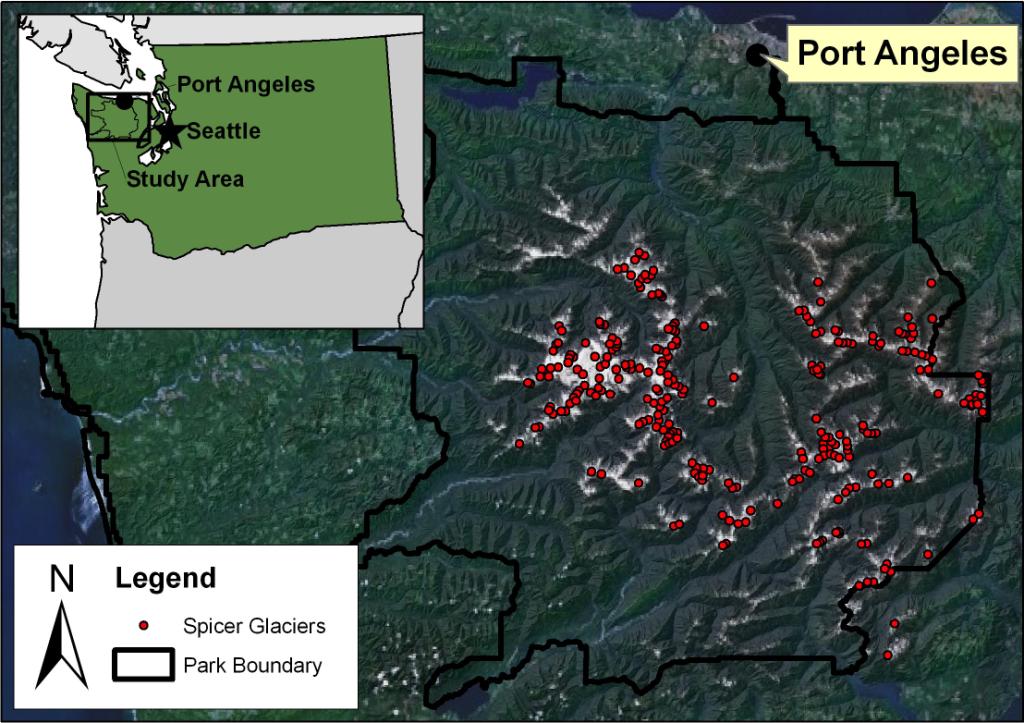
An inventory of glaciers of the Olympic Mountains identified 266 glaciers (Spicer, 1986)(Figure 1). Of the glaciers identified, only two were outside the boundaries of Olympic National Park. The Glaciers of the American West database, administrated by Portland State University, identifies 387 perennial snow and ice features based on USGS 1:24,000 topographic maps with a cumulative area of 37 km2 (Fountain et al., 2007). My thesis has two goals: (1) Re-inventory the glaciers of the Olympic Mountains (2) quantify how the glaciers have changed over the past century and adapt a cellular automata model (Harper and Humphrey, 2003) to predict the location and extent of glaciers in the Olympic Mountains.

Temperate alpine glaciers serve as sensitive indicators of change in regional and global climate (Meier and Tangborn, 1965; Thackray, 2008). Over the last 100 years, glaciers have contributed about one third of observed global sea level rise (Meier, 1984). With the continued retreat of tidewater glaciers to unstable positions, the input of water to the oceans by glaciers has accelerated over the last decade (Meier et al., 2007). Understanding the spatial characteristics of changing glaciers is important for understanding how they are contributing to sea level rise (Meier, 1984).
Previous efforts to document the spatial variability of glaciers in the Olympic Mountains and the relationship to climate have generally been limited to the glaciers of Mount Olympus. Blue Glacier in particular has been the glacier most studied with one of the longest mass balance records in the United States (Conway et al., 1999; LaChappele, 1965). Variations of Hoh Glacier and White Glacier, also on Mount Olympus, have been studied (Heusser, 1957). Limited previous inventories were completed by Meier (1962) and by Olympic National Park staff starting in September 1959 (unpublished ONP report, 1964). Meier identified 61 glaciers in the Olympic Mountains with a cumulative area of 33 km2. Of the 61 identified glaciers, 45 were smaller than 0.5 km2 (Meier and Post, 1962). The Olympic National Park effort to inventory glaciers identified 91 glaciers (19 are named) that exhibited a firn line, crevasses, and/or a terminal moraine (Spicer, 1986). The most recent effort identified 266 glaciers in the Olympic Mountains, all but two of which were within Olympic National Park (Spicer, 1986). The smallest glaciers identified were 0.01 km2 and the largest glacier was Blue Glacier at 5.31 km2. The average area of glaciers inventoried by Spicer (1986) was 0.17 km2. No new effort to update the inventory of glaciers with new imagery has been made since the 1986 inventory, although all glaciers and perennial snowfields were abstracted from USGS 1:24,000 topographic maps (Fountain et al., 2007). Most of these maps were generated from air photos from the mid 1980’s, all though a small number were created from data from as far back as 1943.
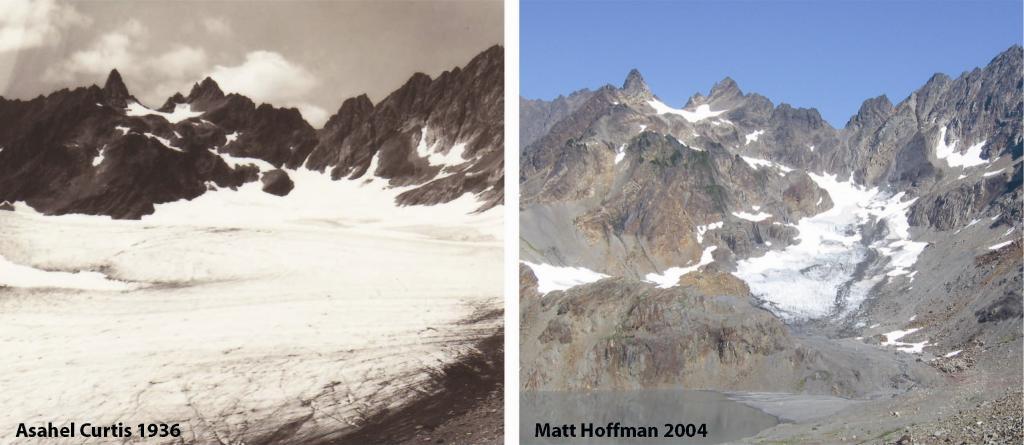
Glacier change in the Olympics between 1890 and 1982 was examined via photographs taken and showed a trend of general recession, with maximum ice loss occurring in the 1930’s and 1940’s (Figure 2). While many glaciers in the Pacific Northwest began to advance in the 1950’s, only three glaciers (Blue, Hoh, and ‘Black’ glaciers) in the Olympic Mountains showed signs of advancing (Meier and Post, 1962; Spicer, 1986). A brief analysis of glacier change in Olympic National Park was completed by Fountain et al. (2009).

My inventory will take advantage of ArcGIS to store data on glacier topography and perimeters. The Spicer inventory is analog and his data will be incorporated into my updated version to the fullest extent possible. To update glacier extents since 1986 I will use available aerial photography in the National Park Service archives and the recent orthorectified aerial photographs made available by the National Agriculture Imagery Program (NAIP). This program provides free digital orthorectified imagery at one meter resolution (Pugh, 2010). Orthorectified imagery for the Olympic Mountains is available for 1990, 2000, 2006, and 2009. The imagery acquired in late summer 2009 will be the basis for digitizing glacier outlines.
High resolution oblique aerial photographs were taken in late summer 2007 by Portland State University and in 2007, 2008, 2009, and 2010 by the National Park Service. While it is difficult to accurately define glacier outlines using oblique aerial photographs, they can be helpful in determining where the ice margin is by providing another perspective when the boundary is not clear in the NAIP imagery. This is especially helpful for parts of a glacier covered by debris or along steep slopes where the glacier margin may be obscured by dark shadows. In cases were determination of the ice margin is not possible by NAIP imagery or oblique aerial photography, individual glaciers may be visited either on foot or by helicopter in late summer 2010 and 2011.
I will adapt a cellular automata model developed for modeling snow and ice flux across a landscape (Harper and Humphrey, 2003) to recreate modern glacial extents as mapped with 2009 NAIP imagery. The model is an equilibrium model and assumes the ice rheology to be perfectly plastic (Paterson, 1994). Current model inputs include a digital elevation model (DEM) and an elevation dependent mass balance gradient. The model accumulates perennial snow based on the prescribed mass balance gradient. A transition rule defined by the critical shear stress determines when and where excess perennial snow should be distributed. The basal shear stress is defined by the slope, ice depth, and density of the ice in the cell (Paterson, 1994). When a basal shear stress of 1 bar is exceeded, excess snow and ice is distributed to the next cell down slope. The model iterates until mass accumulation equals mass loss and glacier size reaches a steady state (Harper and Humphrey, 2003). I adapt this model and remove the constraints imposed by defining the ELA and mass balance curve and replace it with a climate model that simulates the accumulation and ablation of snow and ice. The climate model is based on the precipitation-elevation regressions on independent slopes model (PRISM) (Di Luzio et al., 2008), a gridded data set of temperature and precipitation.
Previous applications of this model (Marcott, 2005, unpublished) have found that south facing glaciers were overestimated in size, but those attempts used simpler elevation based mass balance gradients rather than gridded PRISM climate data. In those cases, the climate parameters used did not account for south facing slopes receiving higher levels of incoming solar radiation. Inclusion of PRISM climate data will help to reduce this overestimation of glacier area because a constant ELA is not assumed.
Conway, H., Rasmussen, L.A., and Marshall, H.-P., 1999, Annual mass balance of Blue Glacier, USA: 1955-97: Geografiska Annaler, v. 81(A), p. 509-520.
Di Luzio, M., Johnson, G.L., Daly, C., Eischeid, J.K., and Arnold, J.G., 2008, Constructing retrospective gridded daily precipitation and temperature datasets for the coterminous United States: Journal of Applied Meteorology and Climatology, v. 47, p. 475-497.
Fountain, A., Basagic, H.J., Hoffman, M., and Thorneycroft, K., 2009, The rapid retreat of glaciers in the national parks of the continental US, Geological Society of America Annual Meeting, Volume 41: Portland, OR, Abstracts with Programs, p. 245.
Fountain, A.G., Hoffman, M., Jackson, K., Basagic, H.J., Nylen, T.H., and Percy, D., 2007, Digital outlines and topography of the glaciers of the American West, Open-File Report 2006-1340, United States Geological Survey.
Harper, J.T., and Humphrey, N.F., 2003, High altitude Himalayan climate inferred from glacial ice flux: Geophysical Research Letters, v. 30, p. 4.
Heusser, C.J., 1957, Variations of Blue, Hoh, and White Glaciers during recent centuries: Arctic, v. 10, p. 139.
LaChappele, E., 1965, The mass budget of Blue Glacier, Washington: Journal of Glaciology, v. 5, p. 609-623.
Meier, M.F., 1984, Contribution of small glaciers to global sea level: Science, v. 226, p. 1418-1421.
Meier, M.F., Dyurgerov, M.B., Rick, U.K., O'Neel, S., Pfeffer, W.T., Anderson, R.S., Anderson, S.P., and Glazovsky, A.F., 2007, Glaciers dominate eustatic sea-level rise in the 21st century: Science, v. 317, p. 1064-1067.
Meier, M.F., and Post, A.S., 1962, Recent variations in mass net budgets of glaciers in western North America: Variations of the Regime of Existing Glaciers, IAHS Publication, v. 58, p. 63-77.
Meier, M.F., and Tangborn, W.V., 1965, Net budget and flow of South Cascade Glacier, Washington: Journal of Glaciology, v. 5, p. 547.
Paterson, W.S.B., 1994, The Physics of Glaciers: Oxford, Butterworth-Heinemann, 481 p.
Pugh, N., 2010, 2010 National Agriculture Imagery Program (NAIP) information sheet, in Agency, U.S.D.o.A.-F.S., ed.
Spicer, R.C., 1986, Glaciers in the Olympic Mountains, Washington: Present distribution and recent variations: Seattle, University of Washington.
Thackray, G.D., 2008, Varied climatic and topographic influences on Late Pleistocene mountain glaciation in the western United States: Journal of Quaternary Science, v. 23, p. 671-681.