ASSIGNMENT
A sampling of the spatial characteristics of glaciers in the lower 48 states.

Photo
Panorama: North Cascades Range, Washington by Frank Granshaw.
The intent of this assignment is to acquaint you with the spatial characteristics of a sampling of glaciers within the lower 48 United States and to help you make the connection with spatial patterns in climate.
Because of the size of the image files (1.7 - 3.2 Mb) you will be using, I recommend you do this assignment at a computer on campus.
1. Eight glacierized areas have been scanned:
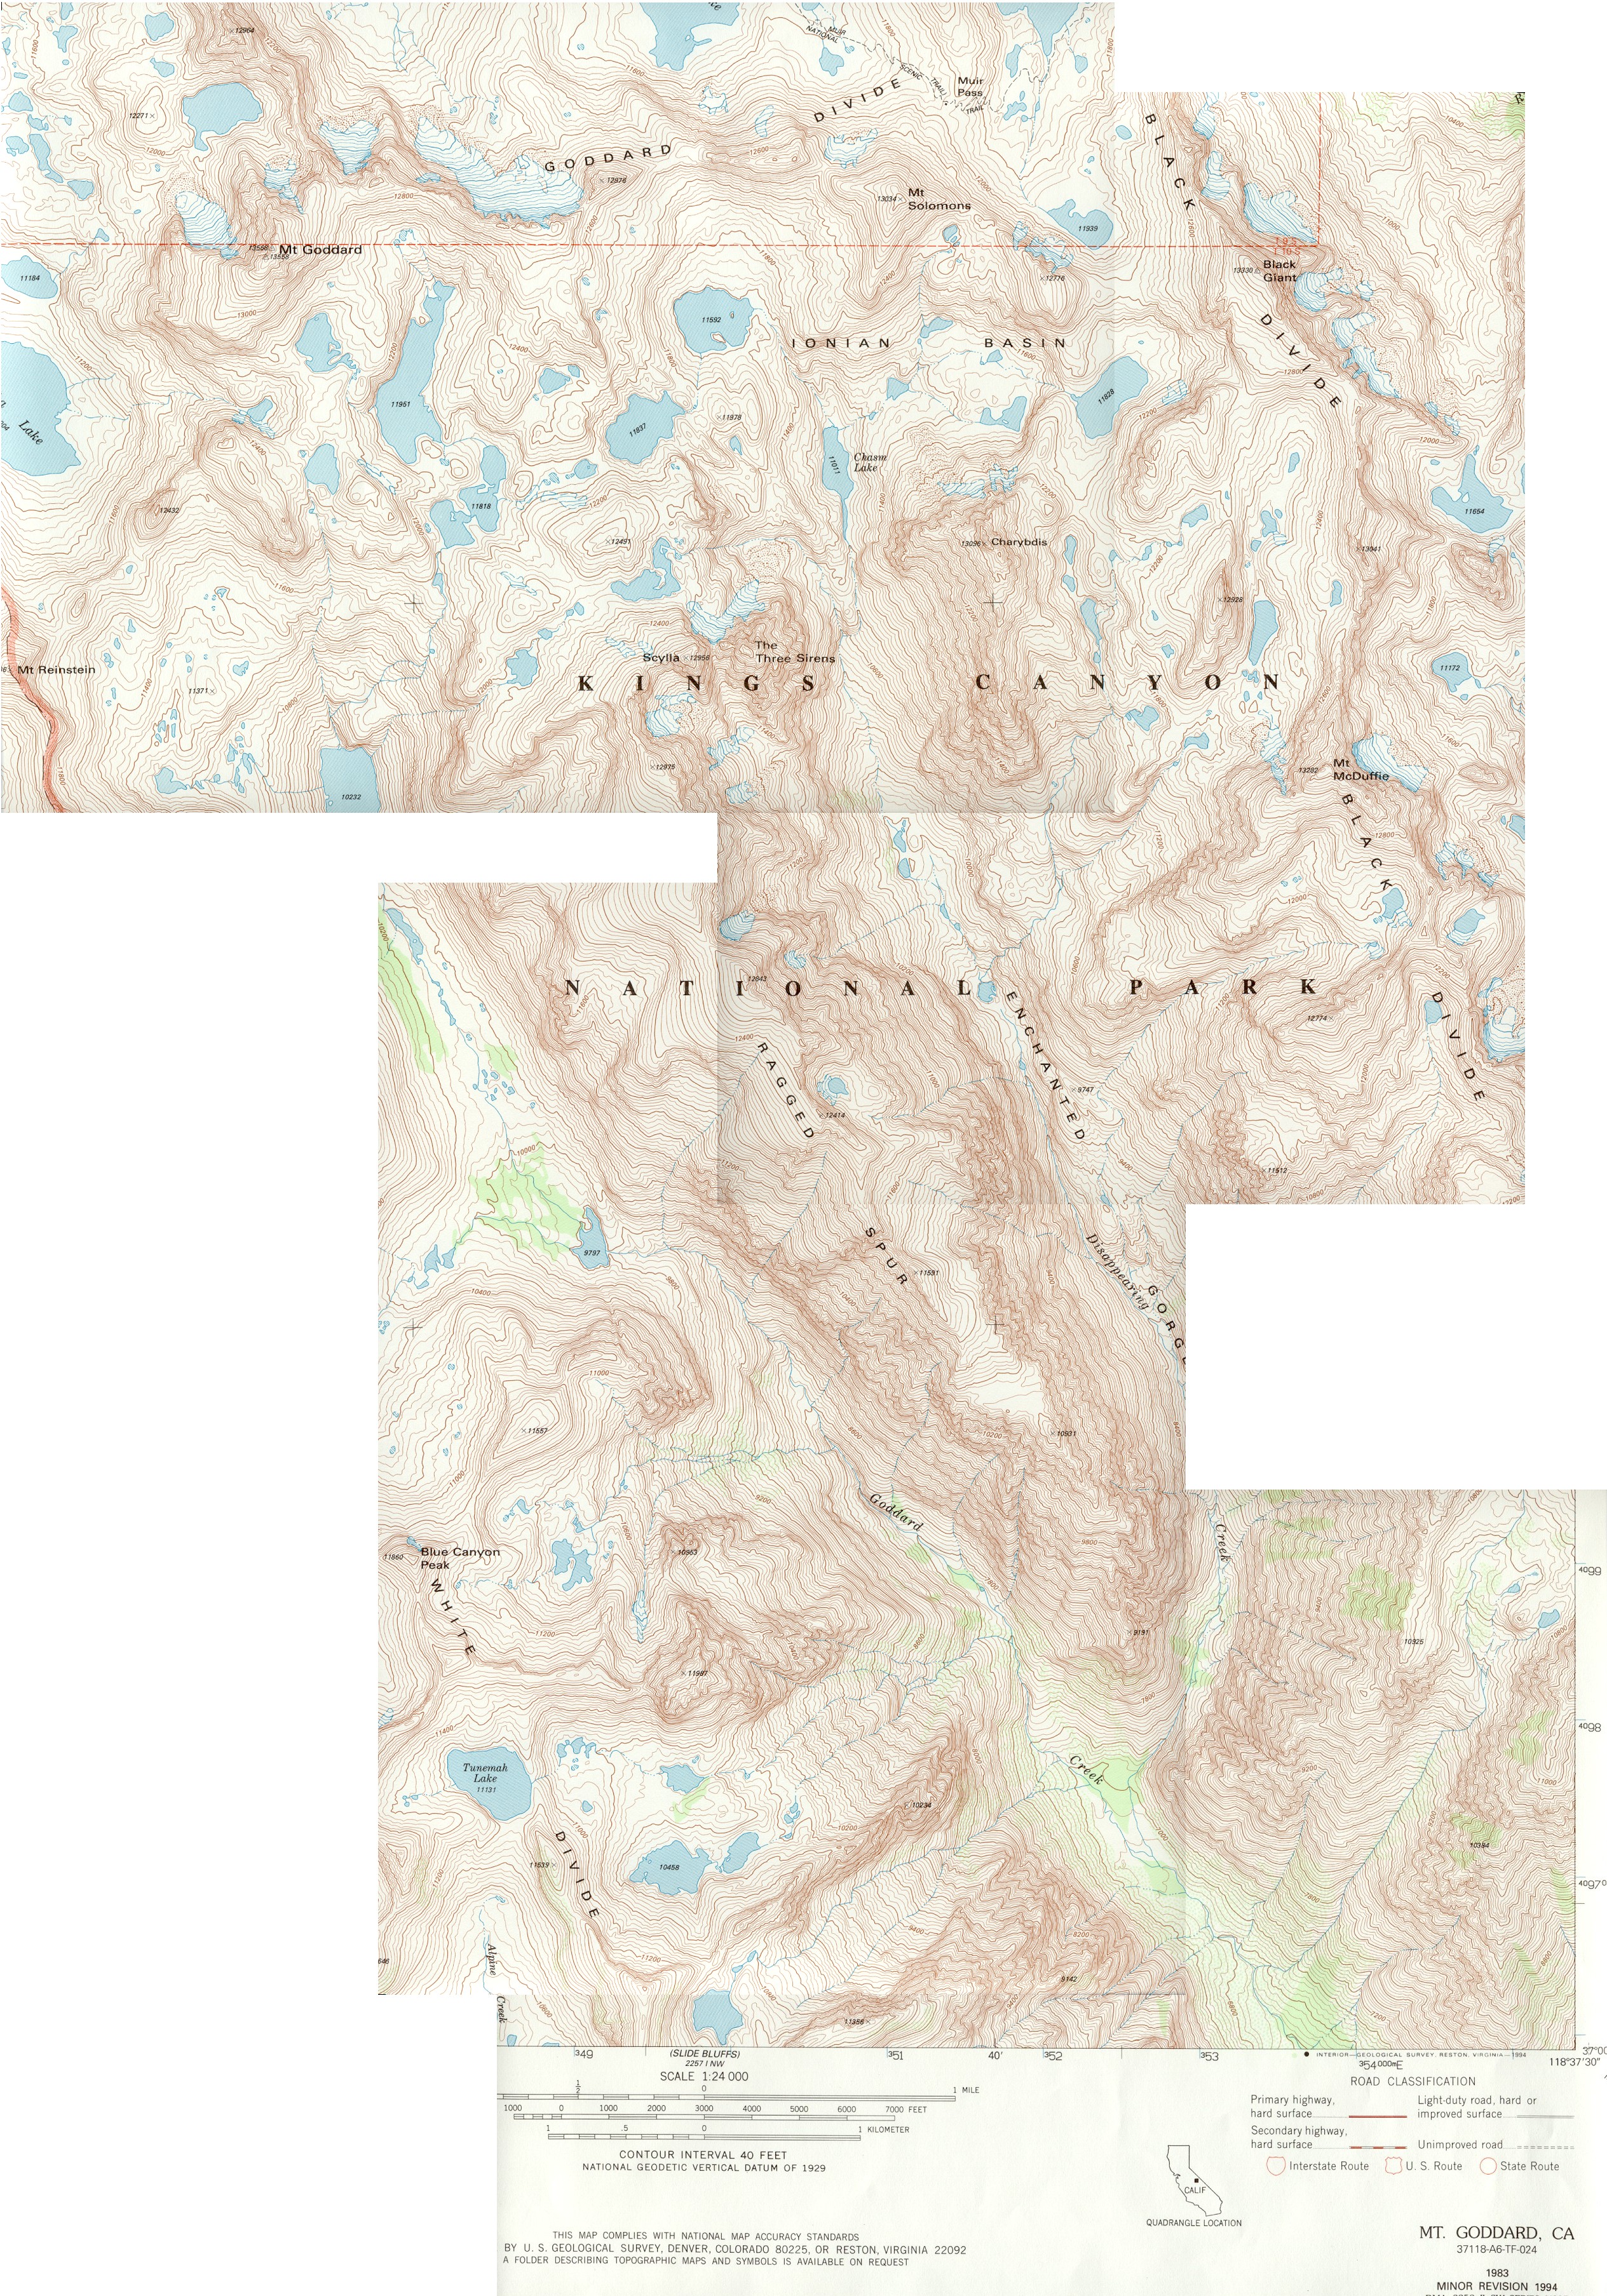
California: Sierra Nevada Mountains Mt Goddard quadrangle
small scale map of Mount Goddard quadrangle
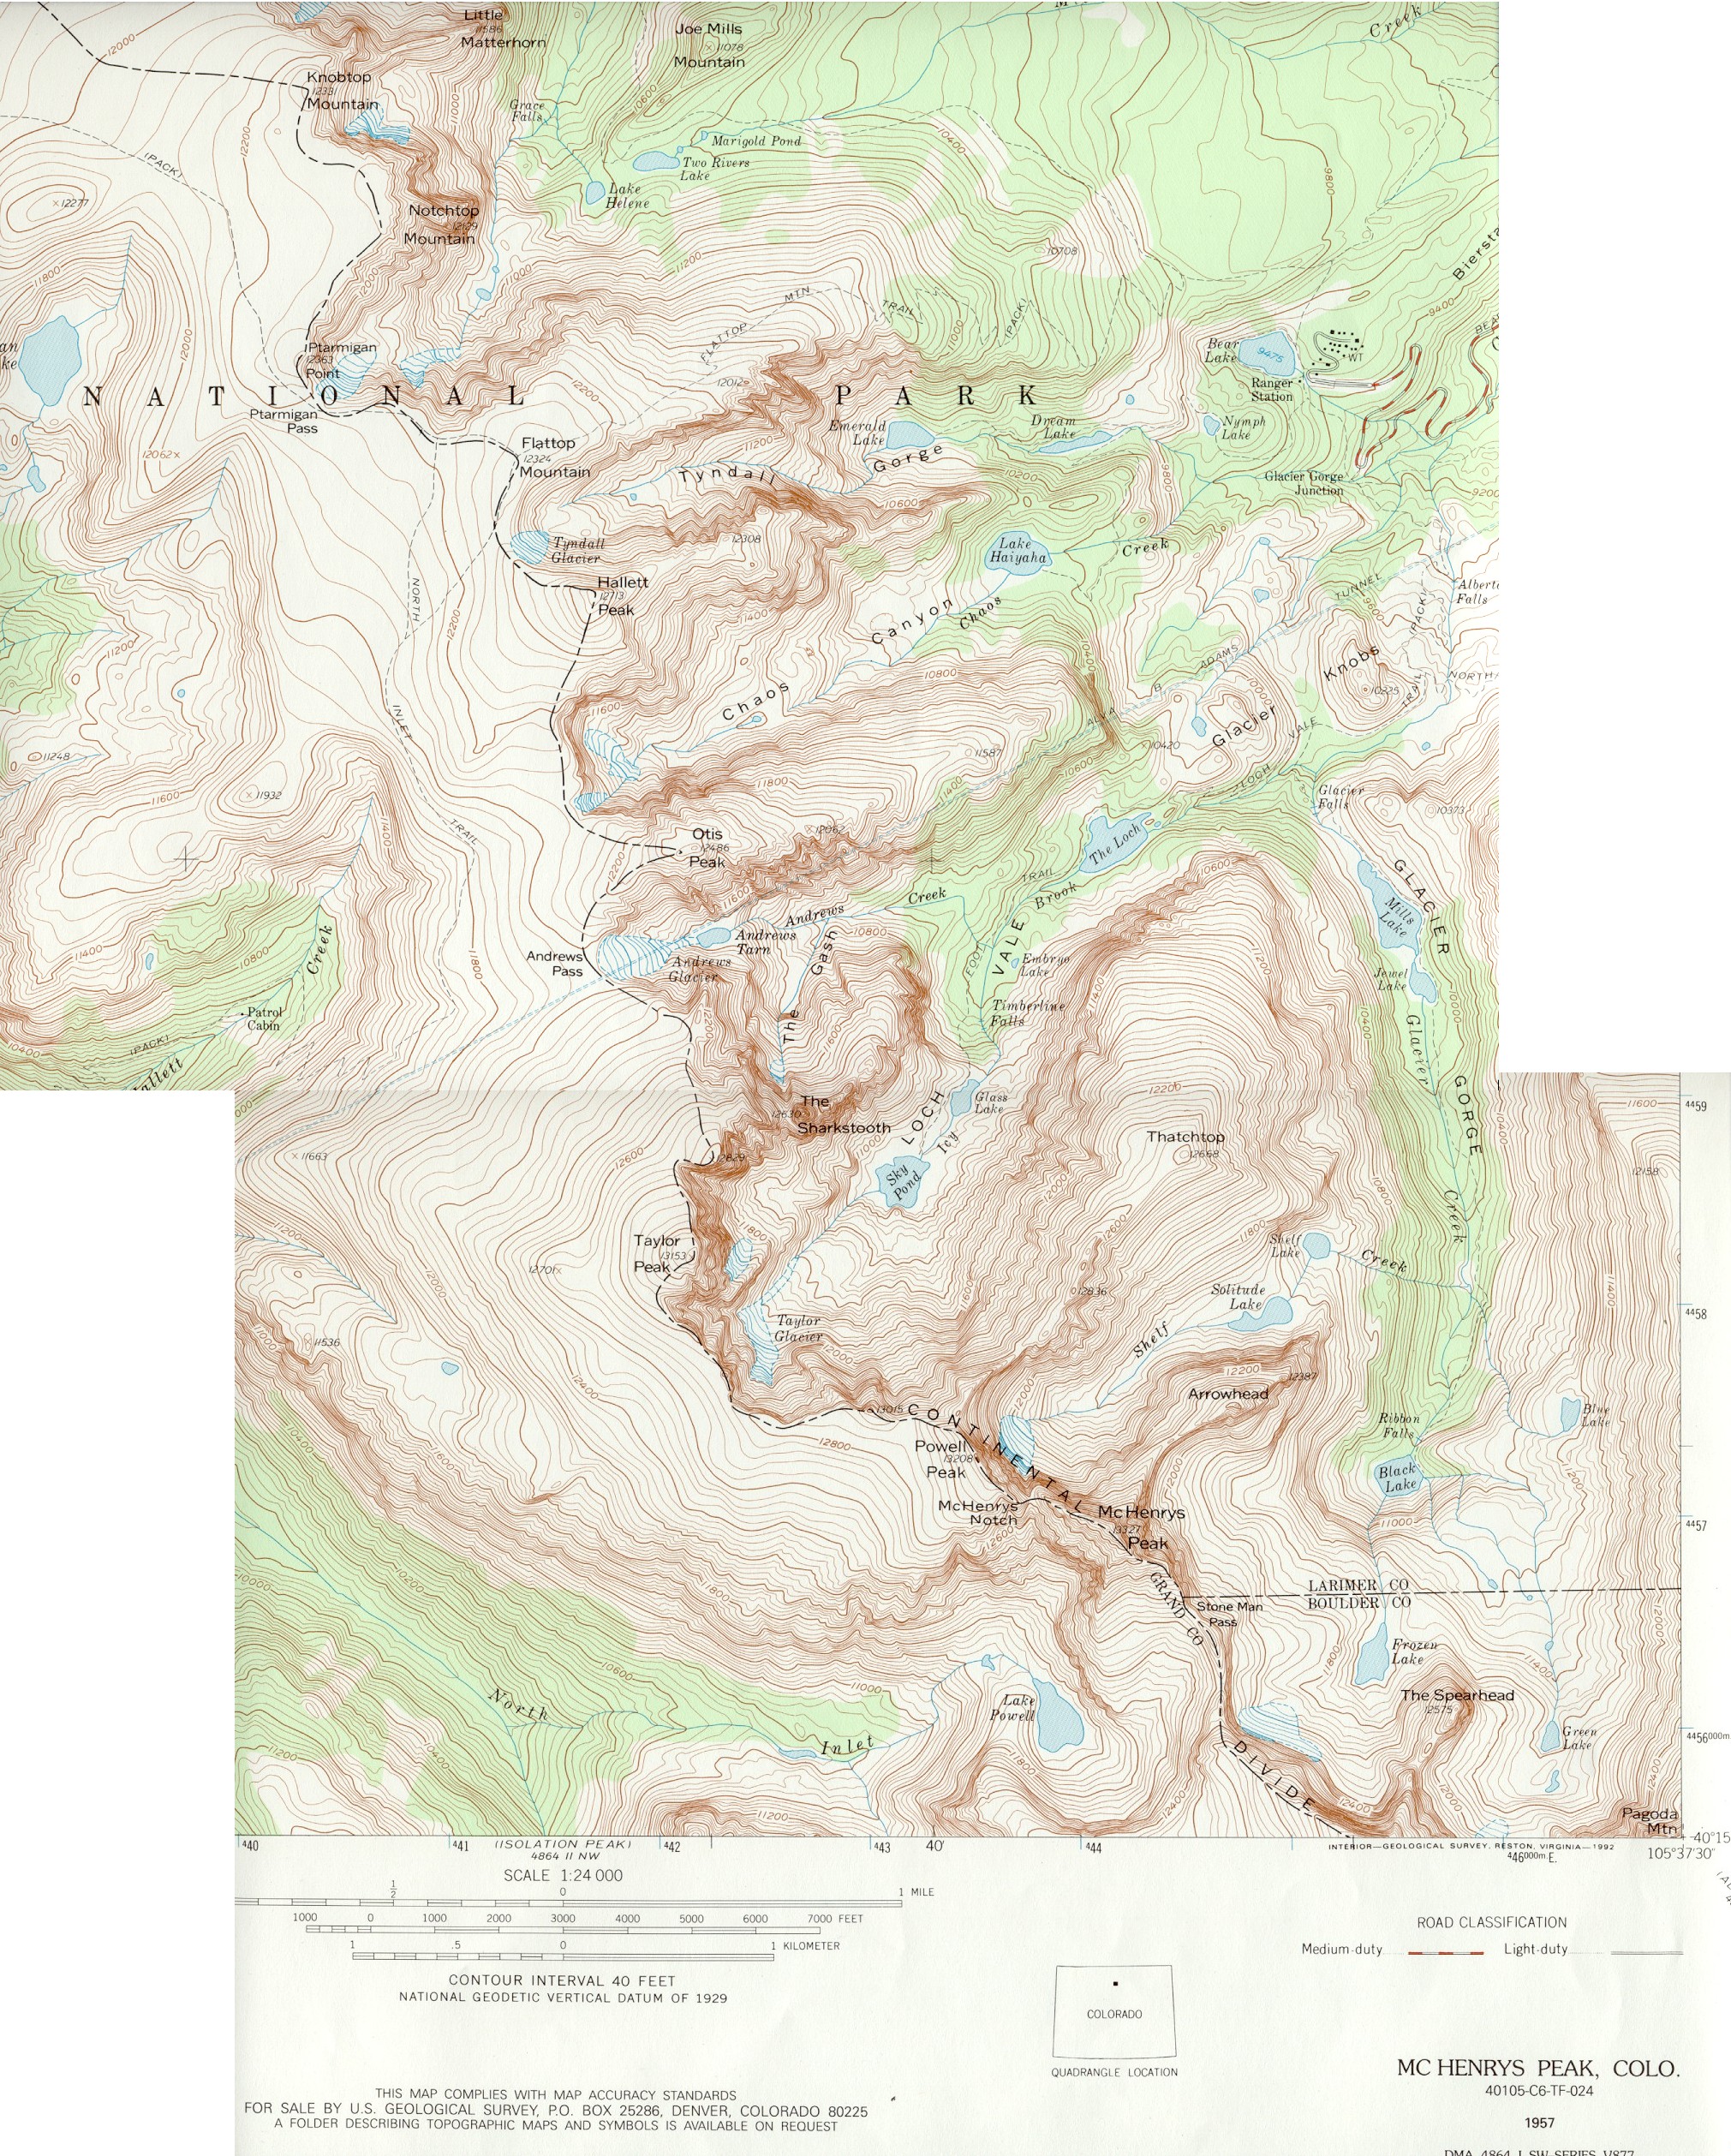
Photo of Mount GoddardColorado: Front Range (Rocky Mountain National Park): McHenrys Peak quadrangle
small scale map of McHenrys Peak quadrangle
Photo of the peaks from Glacier Basin.Montana:
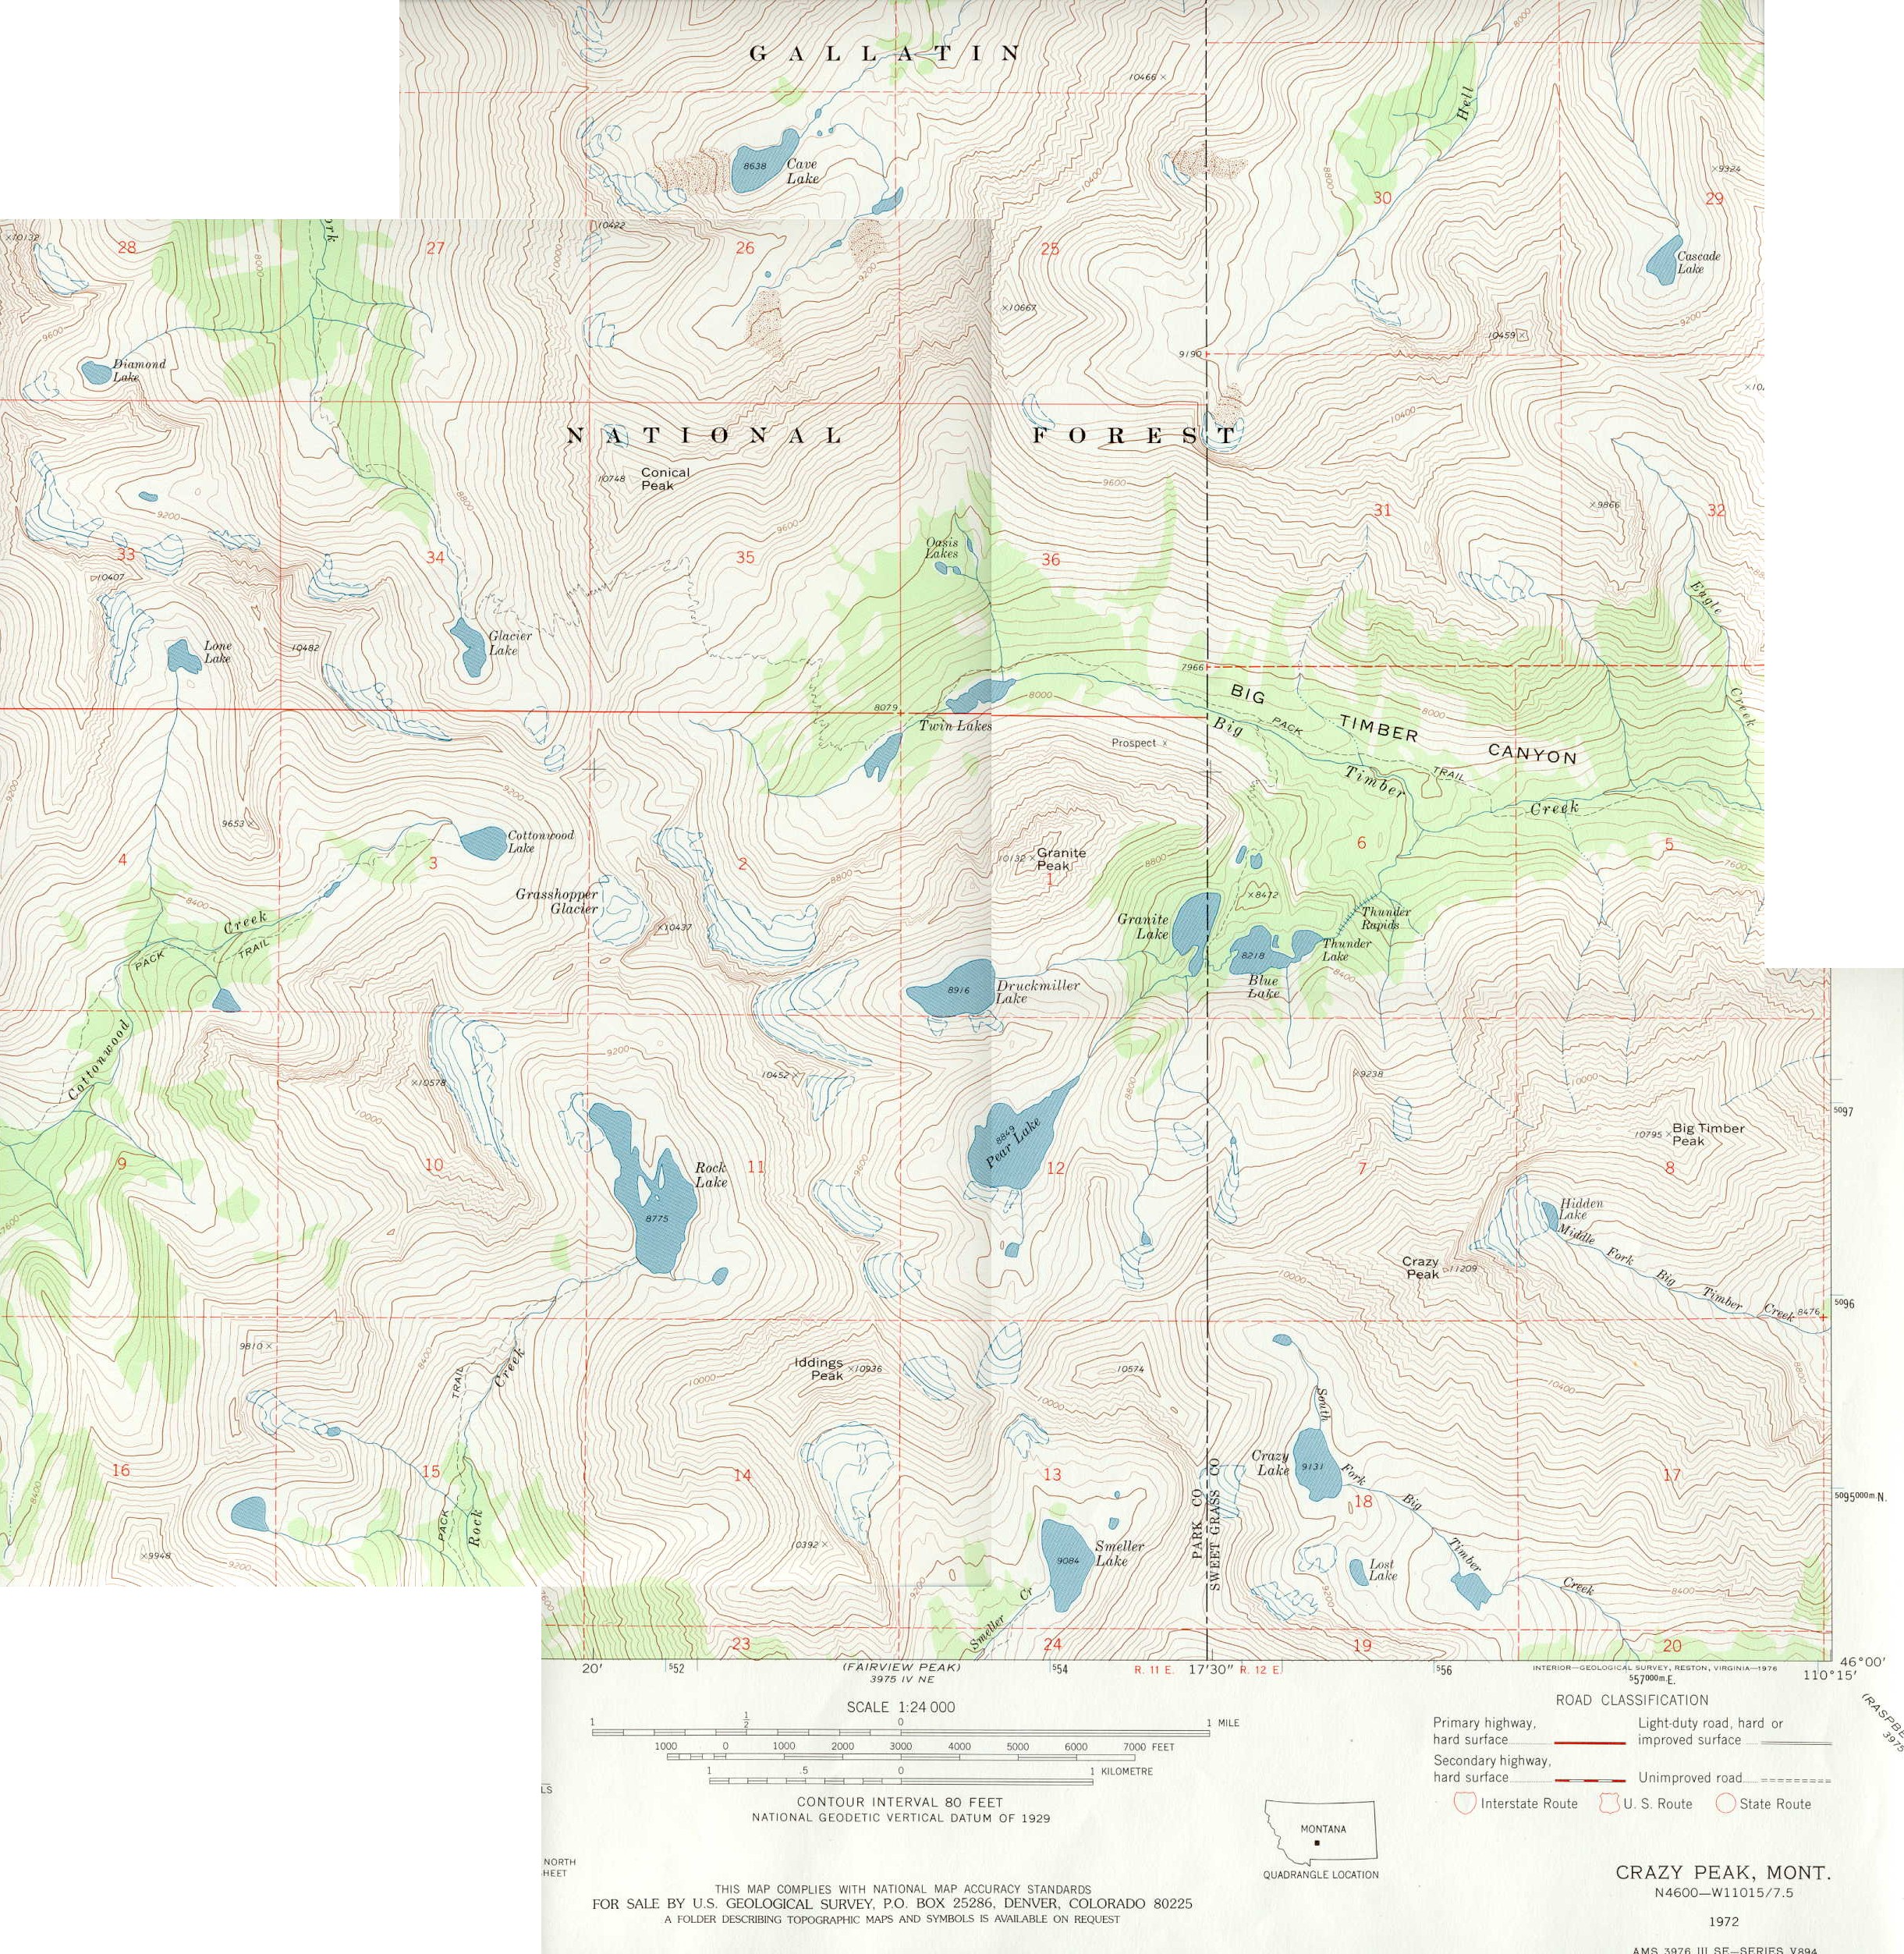
Crazy Peak in the Crazy Mountains.
small scale map of Crazy Peak
Photo of Campfire Lake
Note that the famed Grasshopper Glacier is included on the map.
For more information on this curious name see:
http://www.fs.fed.us/r1/custer/Recreation/grasshopper.htm
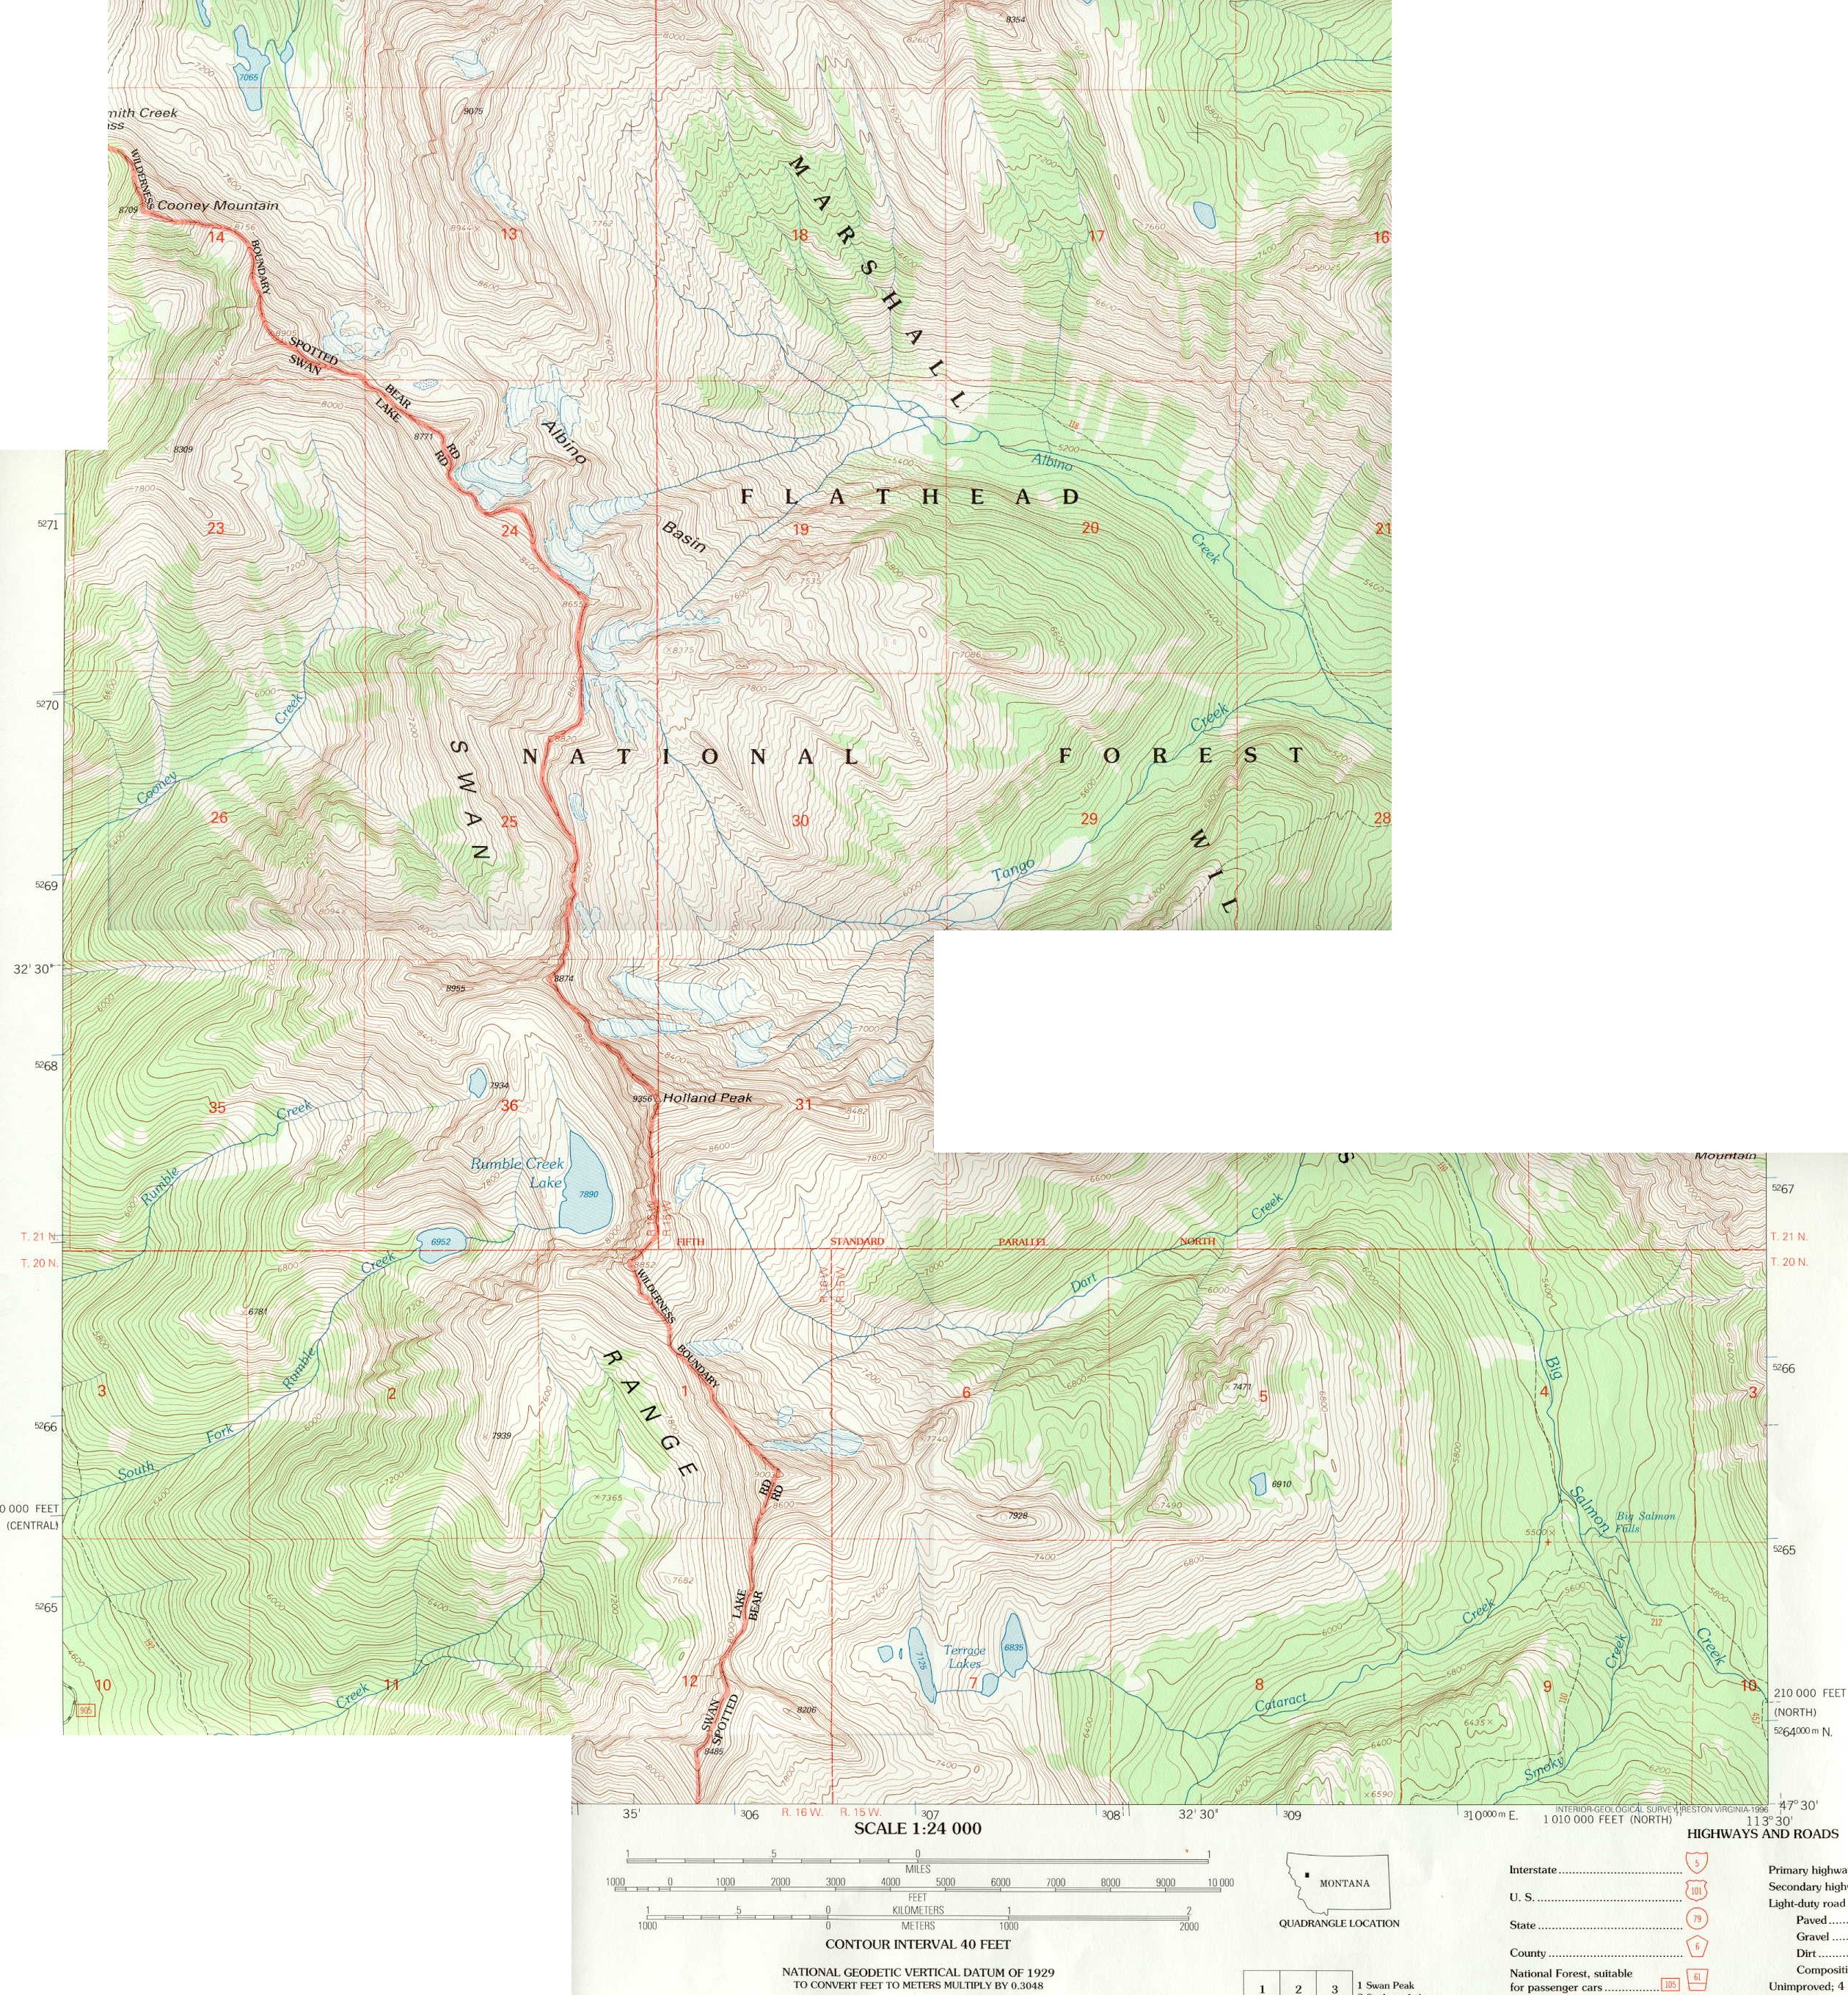
Holland Peak in the Bob Marshall Wilderness
small scale map of Holland Peak
Washington: North Cascades Range
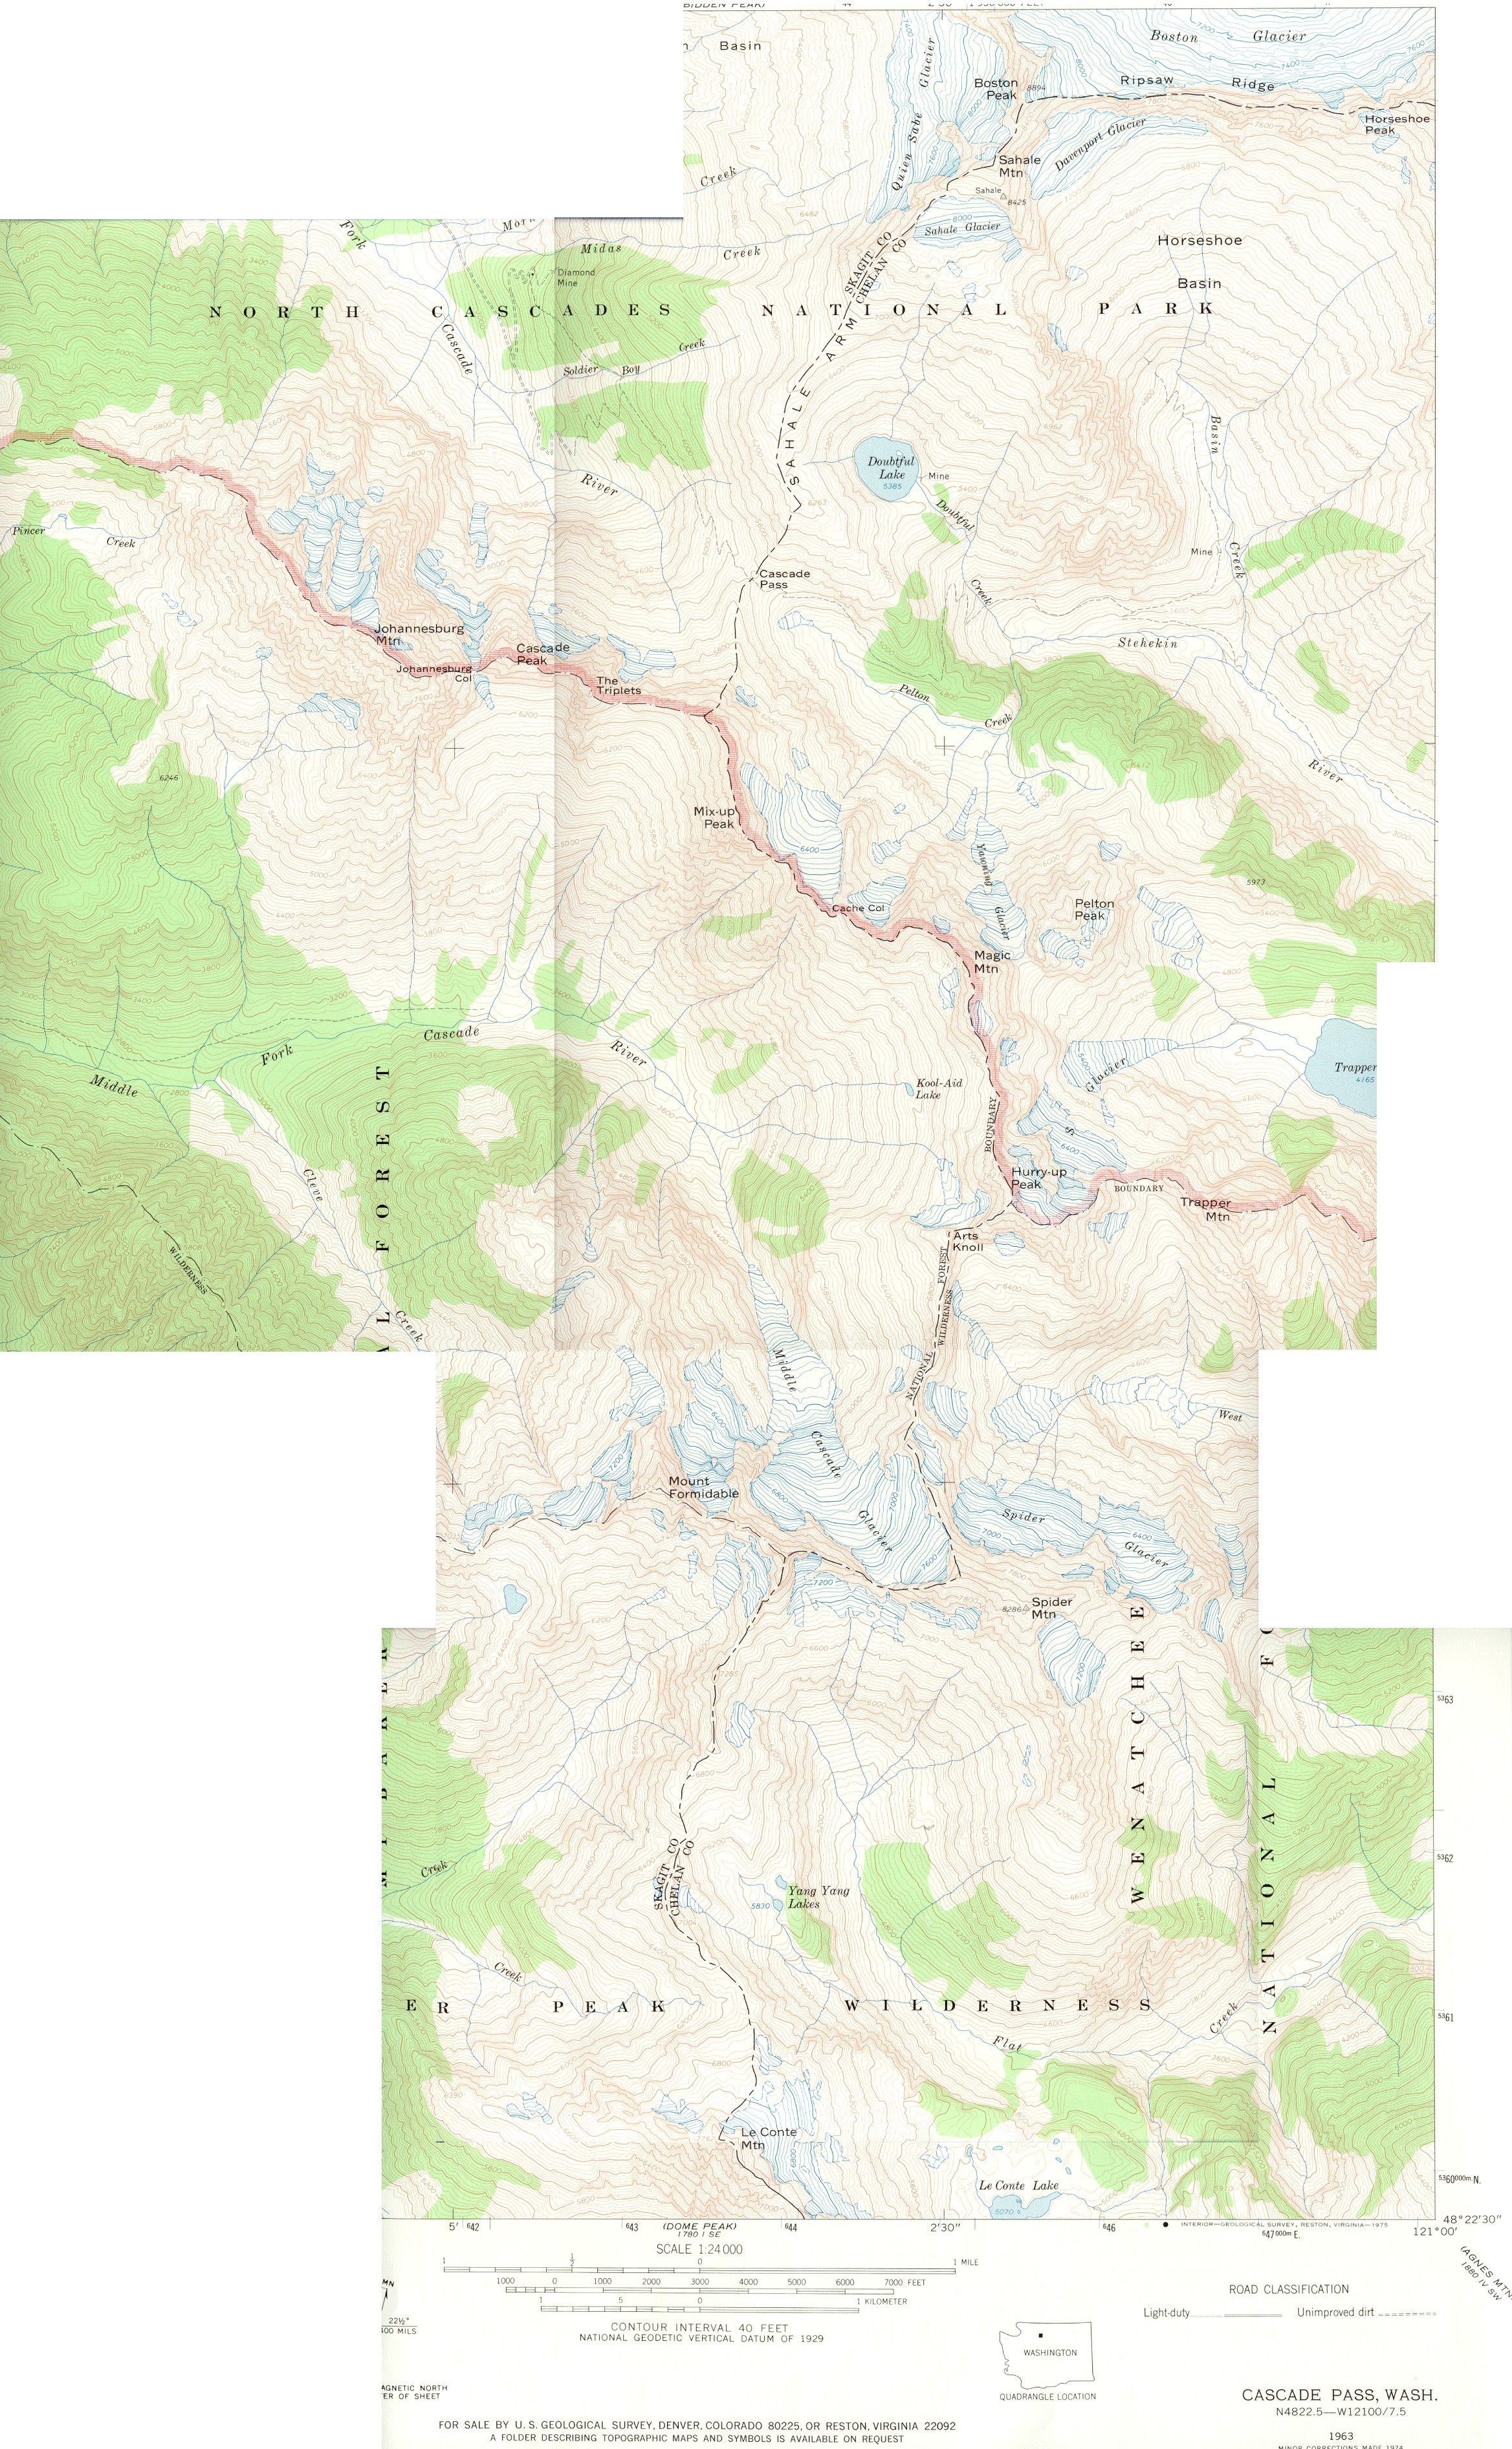
Cascade Pass quadrangle
small scale map of Cascade Pass
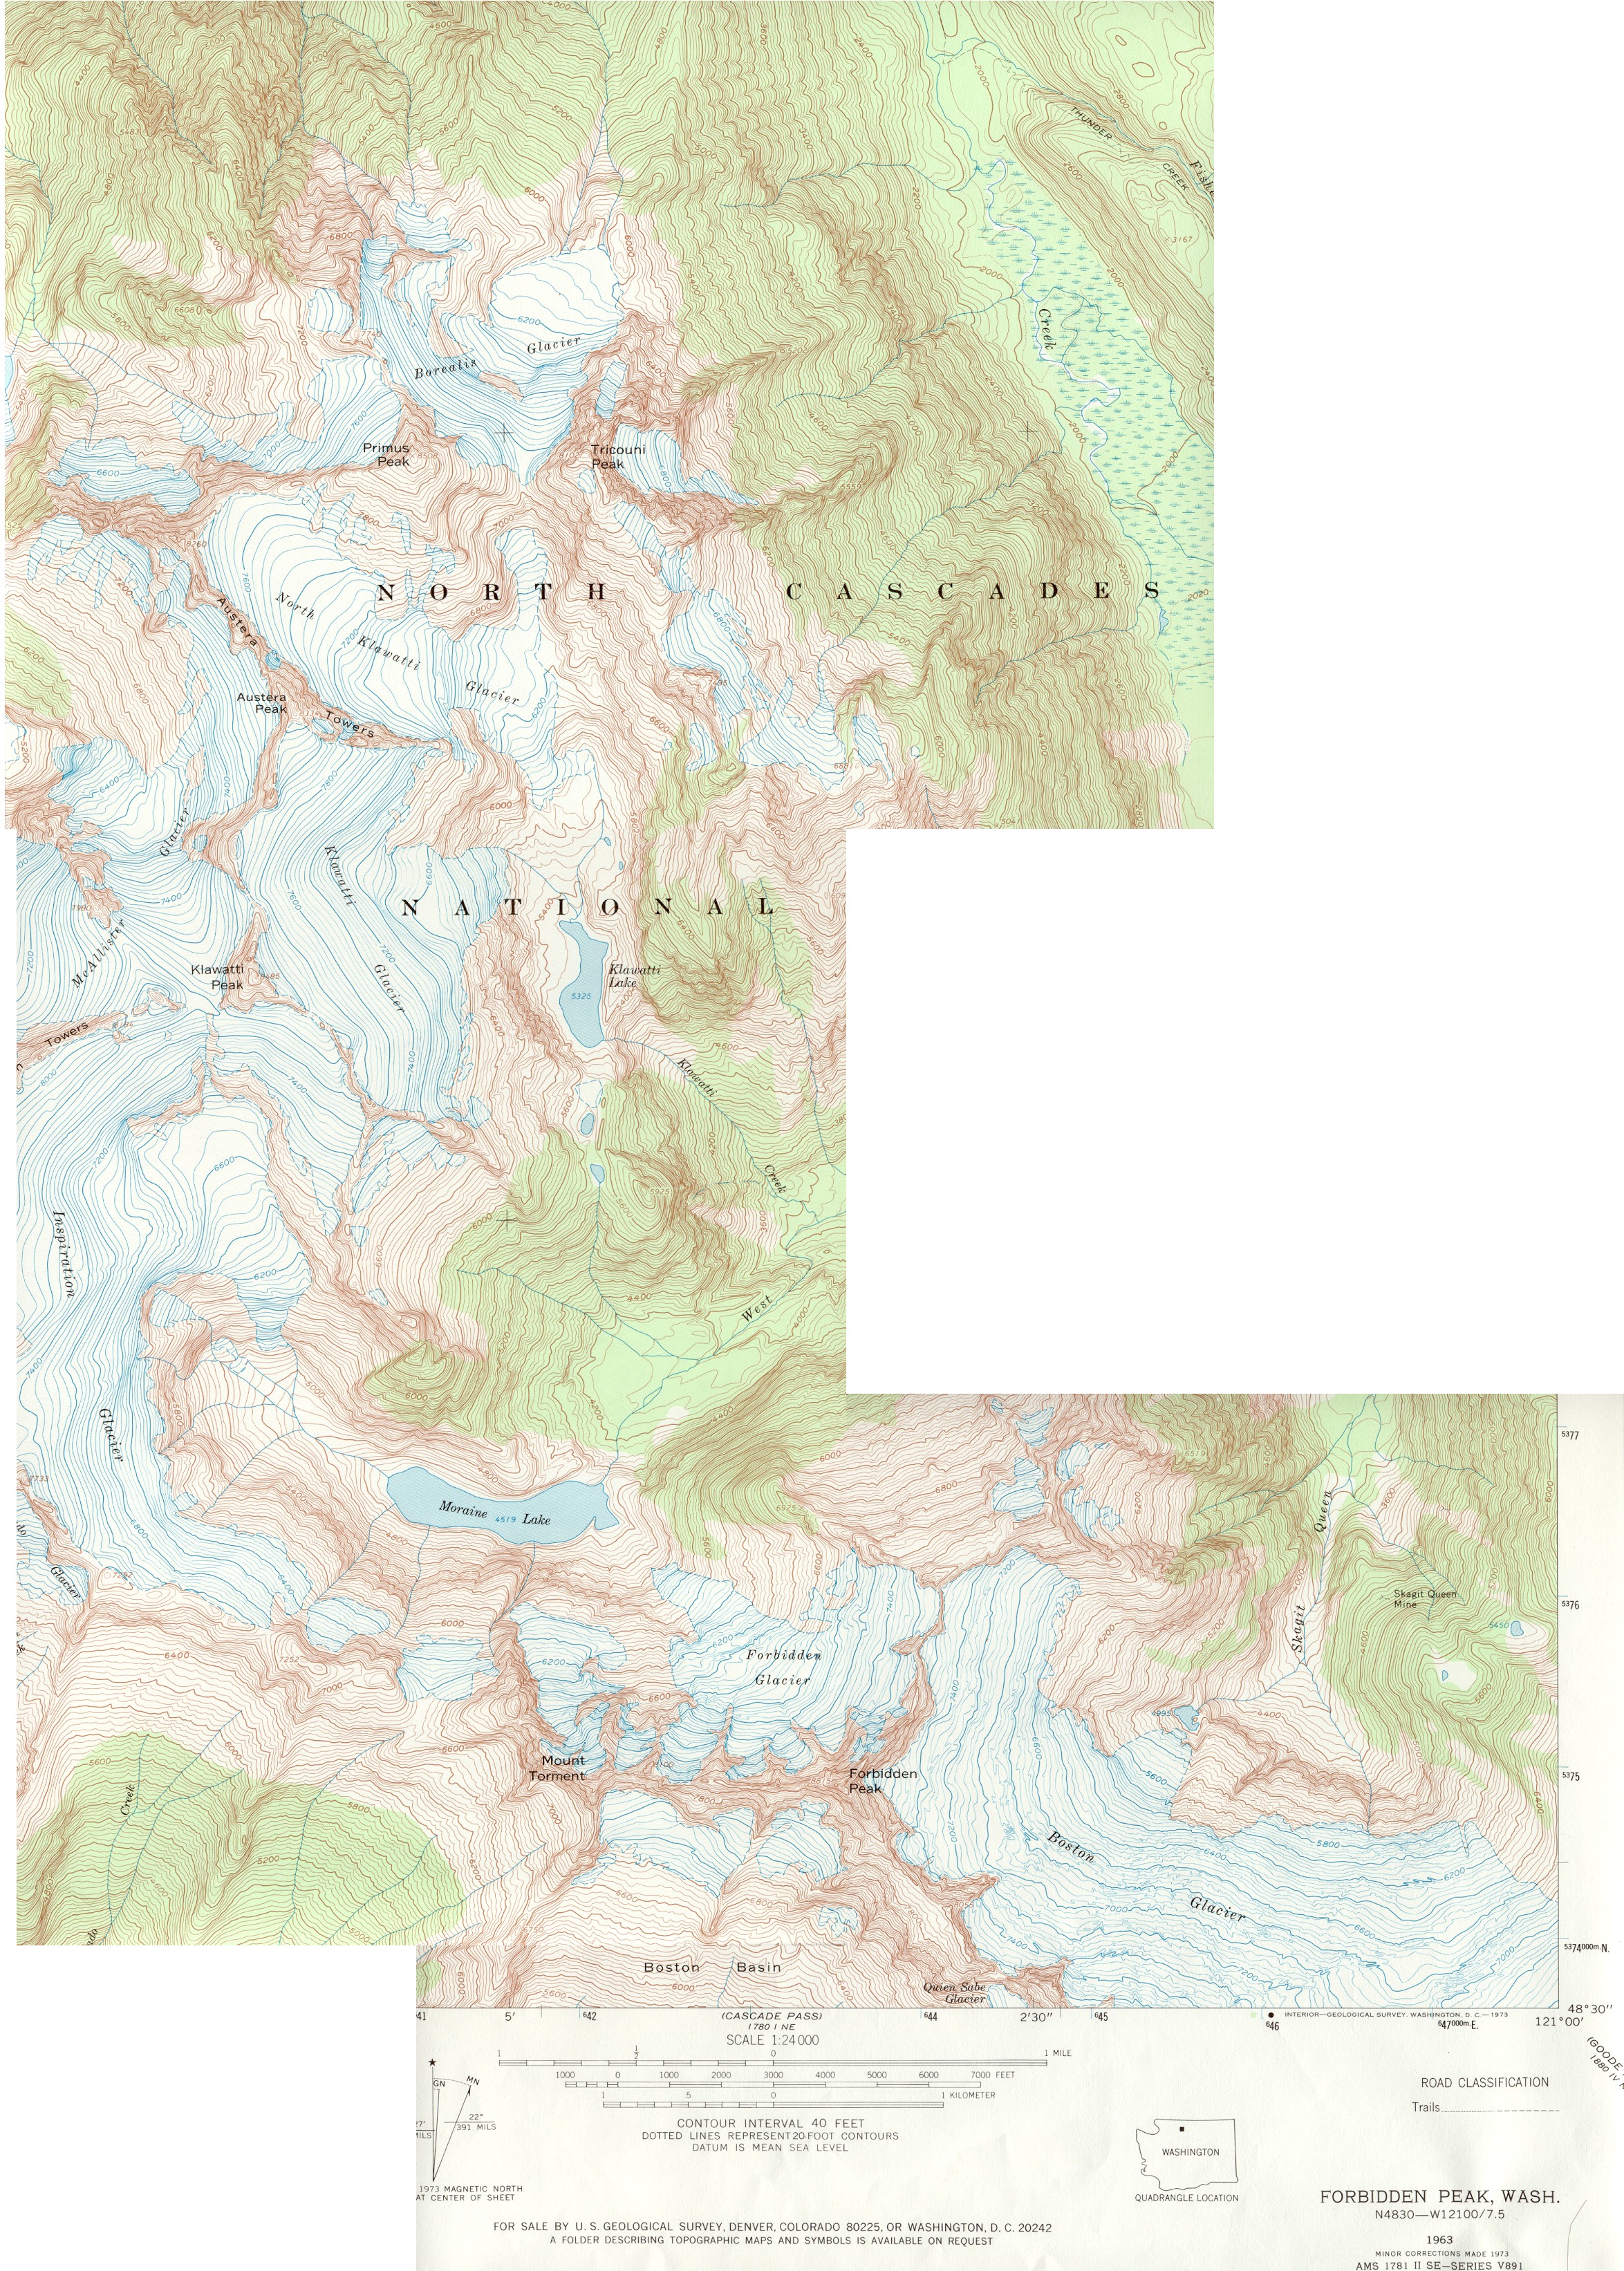
Forbidden Peak quadrangle
small scale map of Forbidden Peak
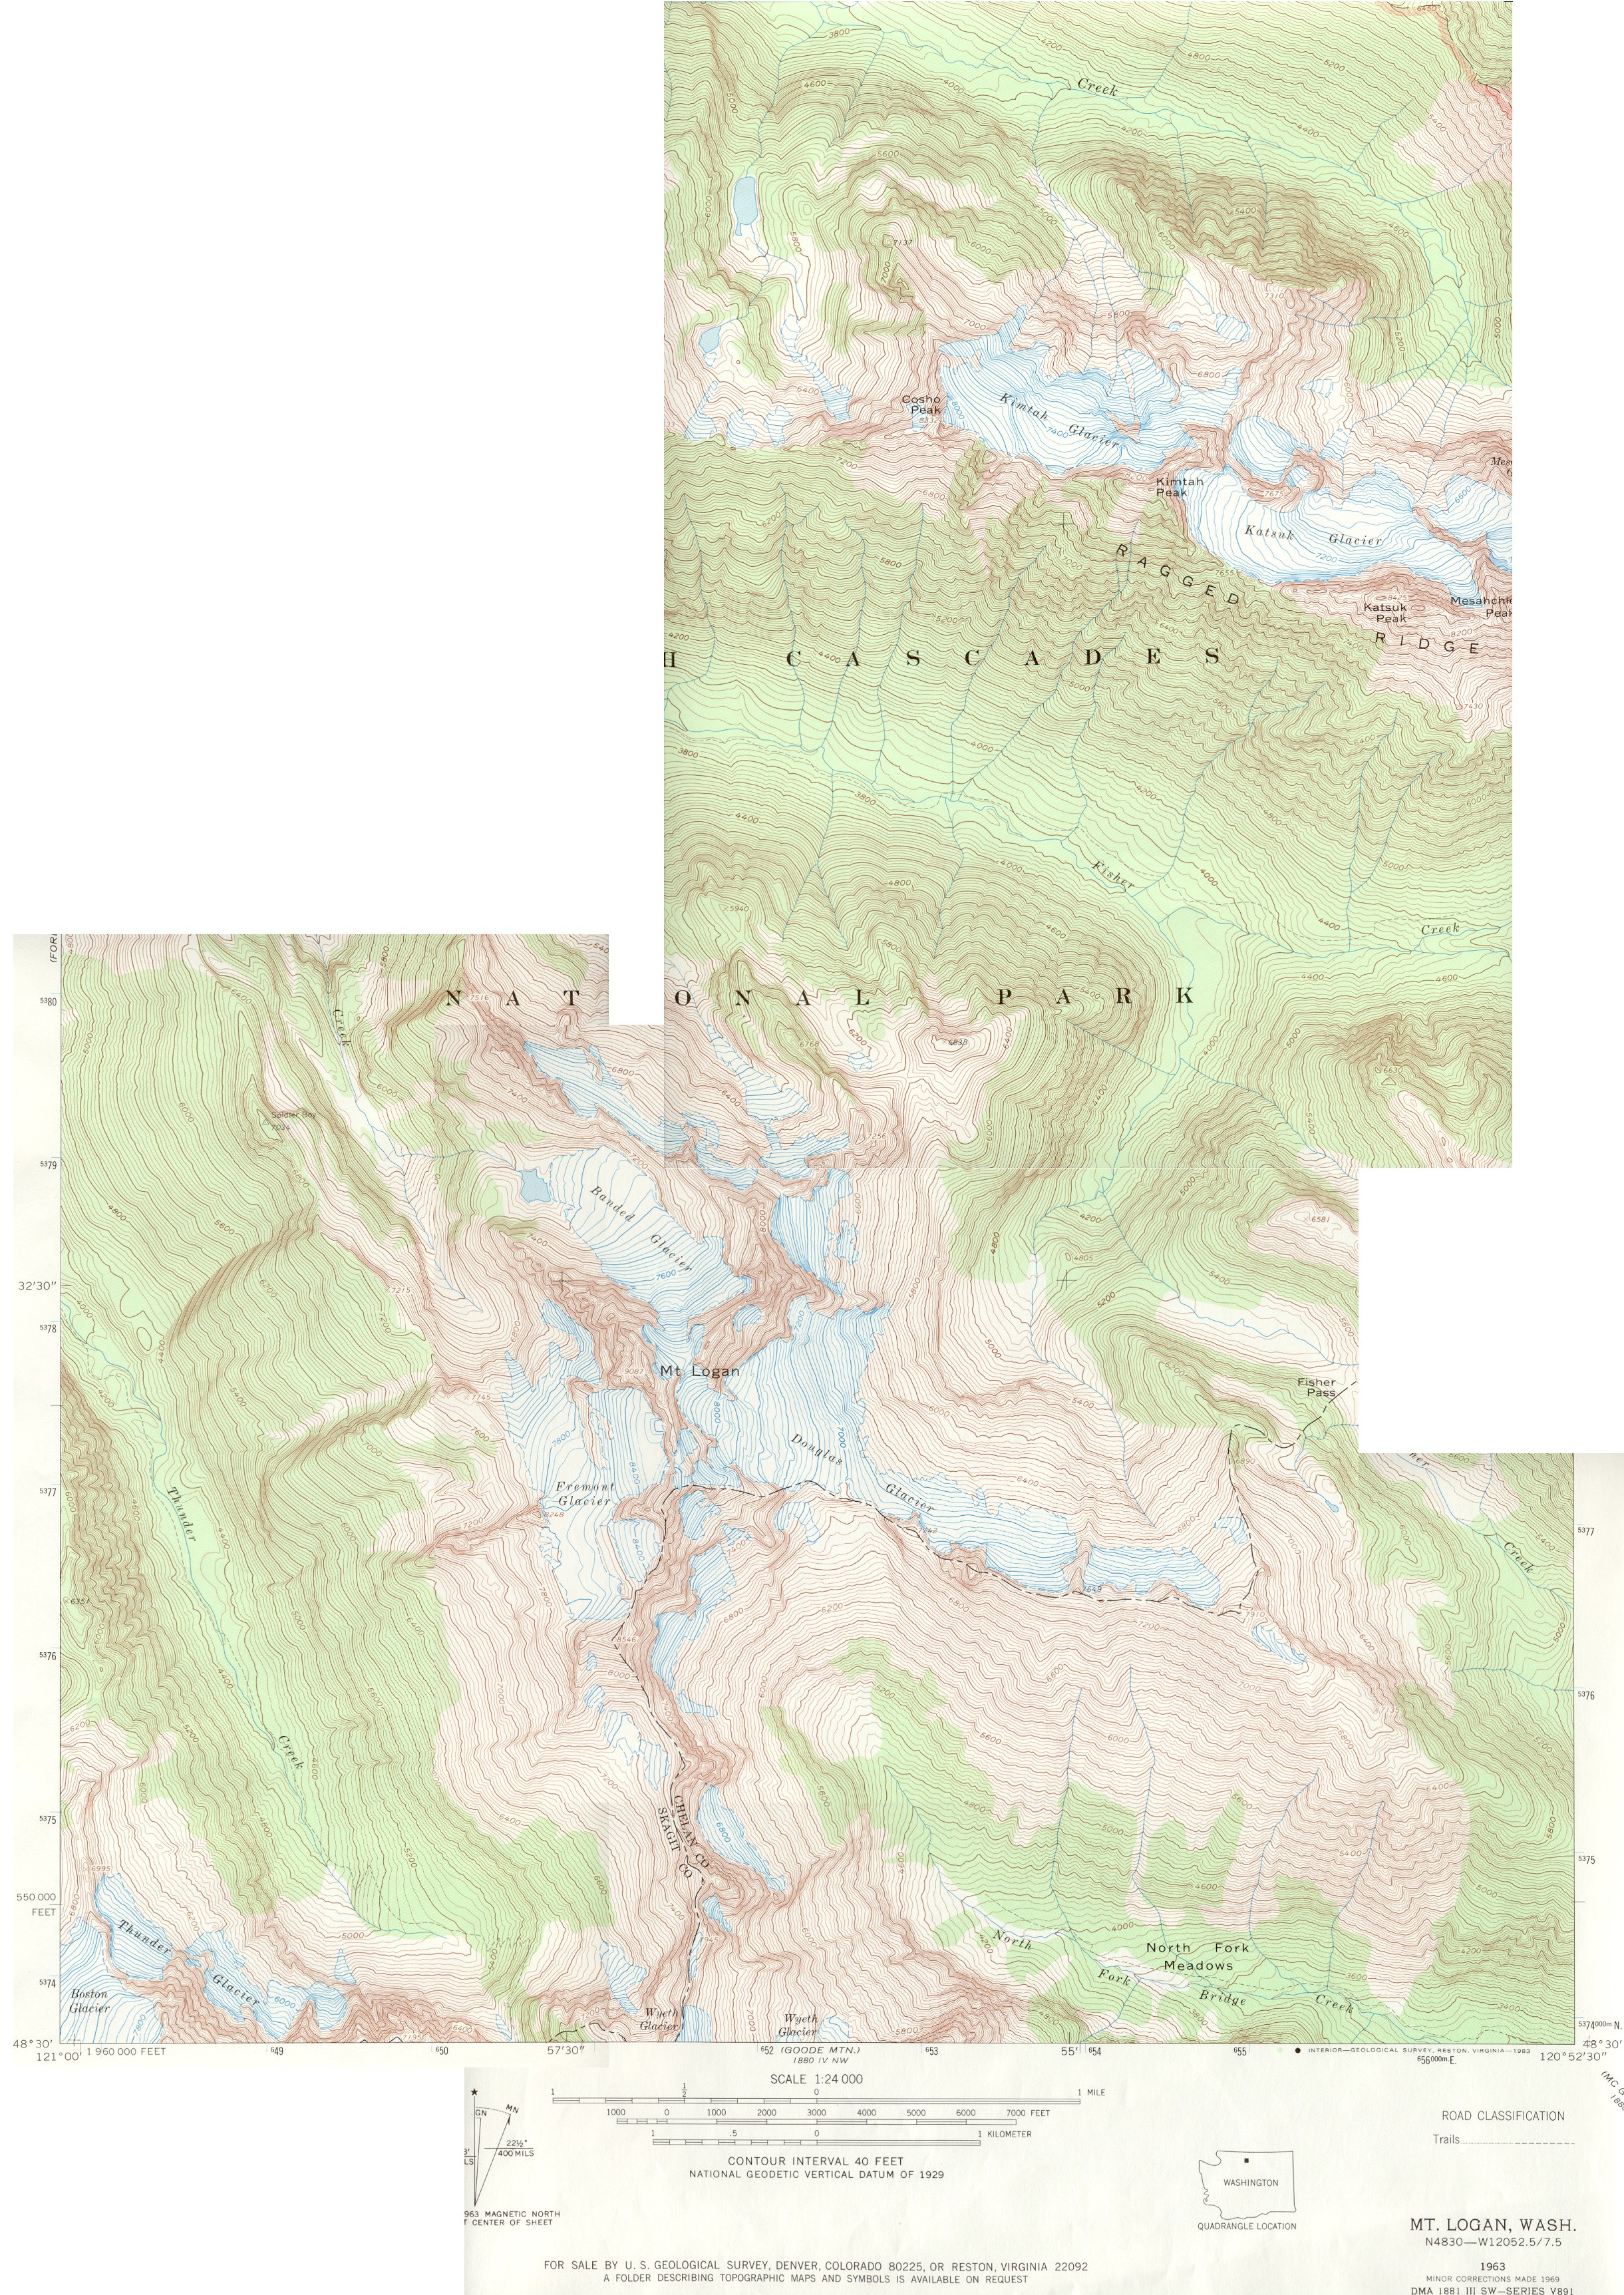
Mount Logan quadrangle
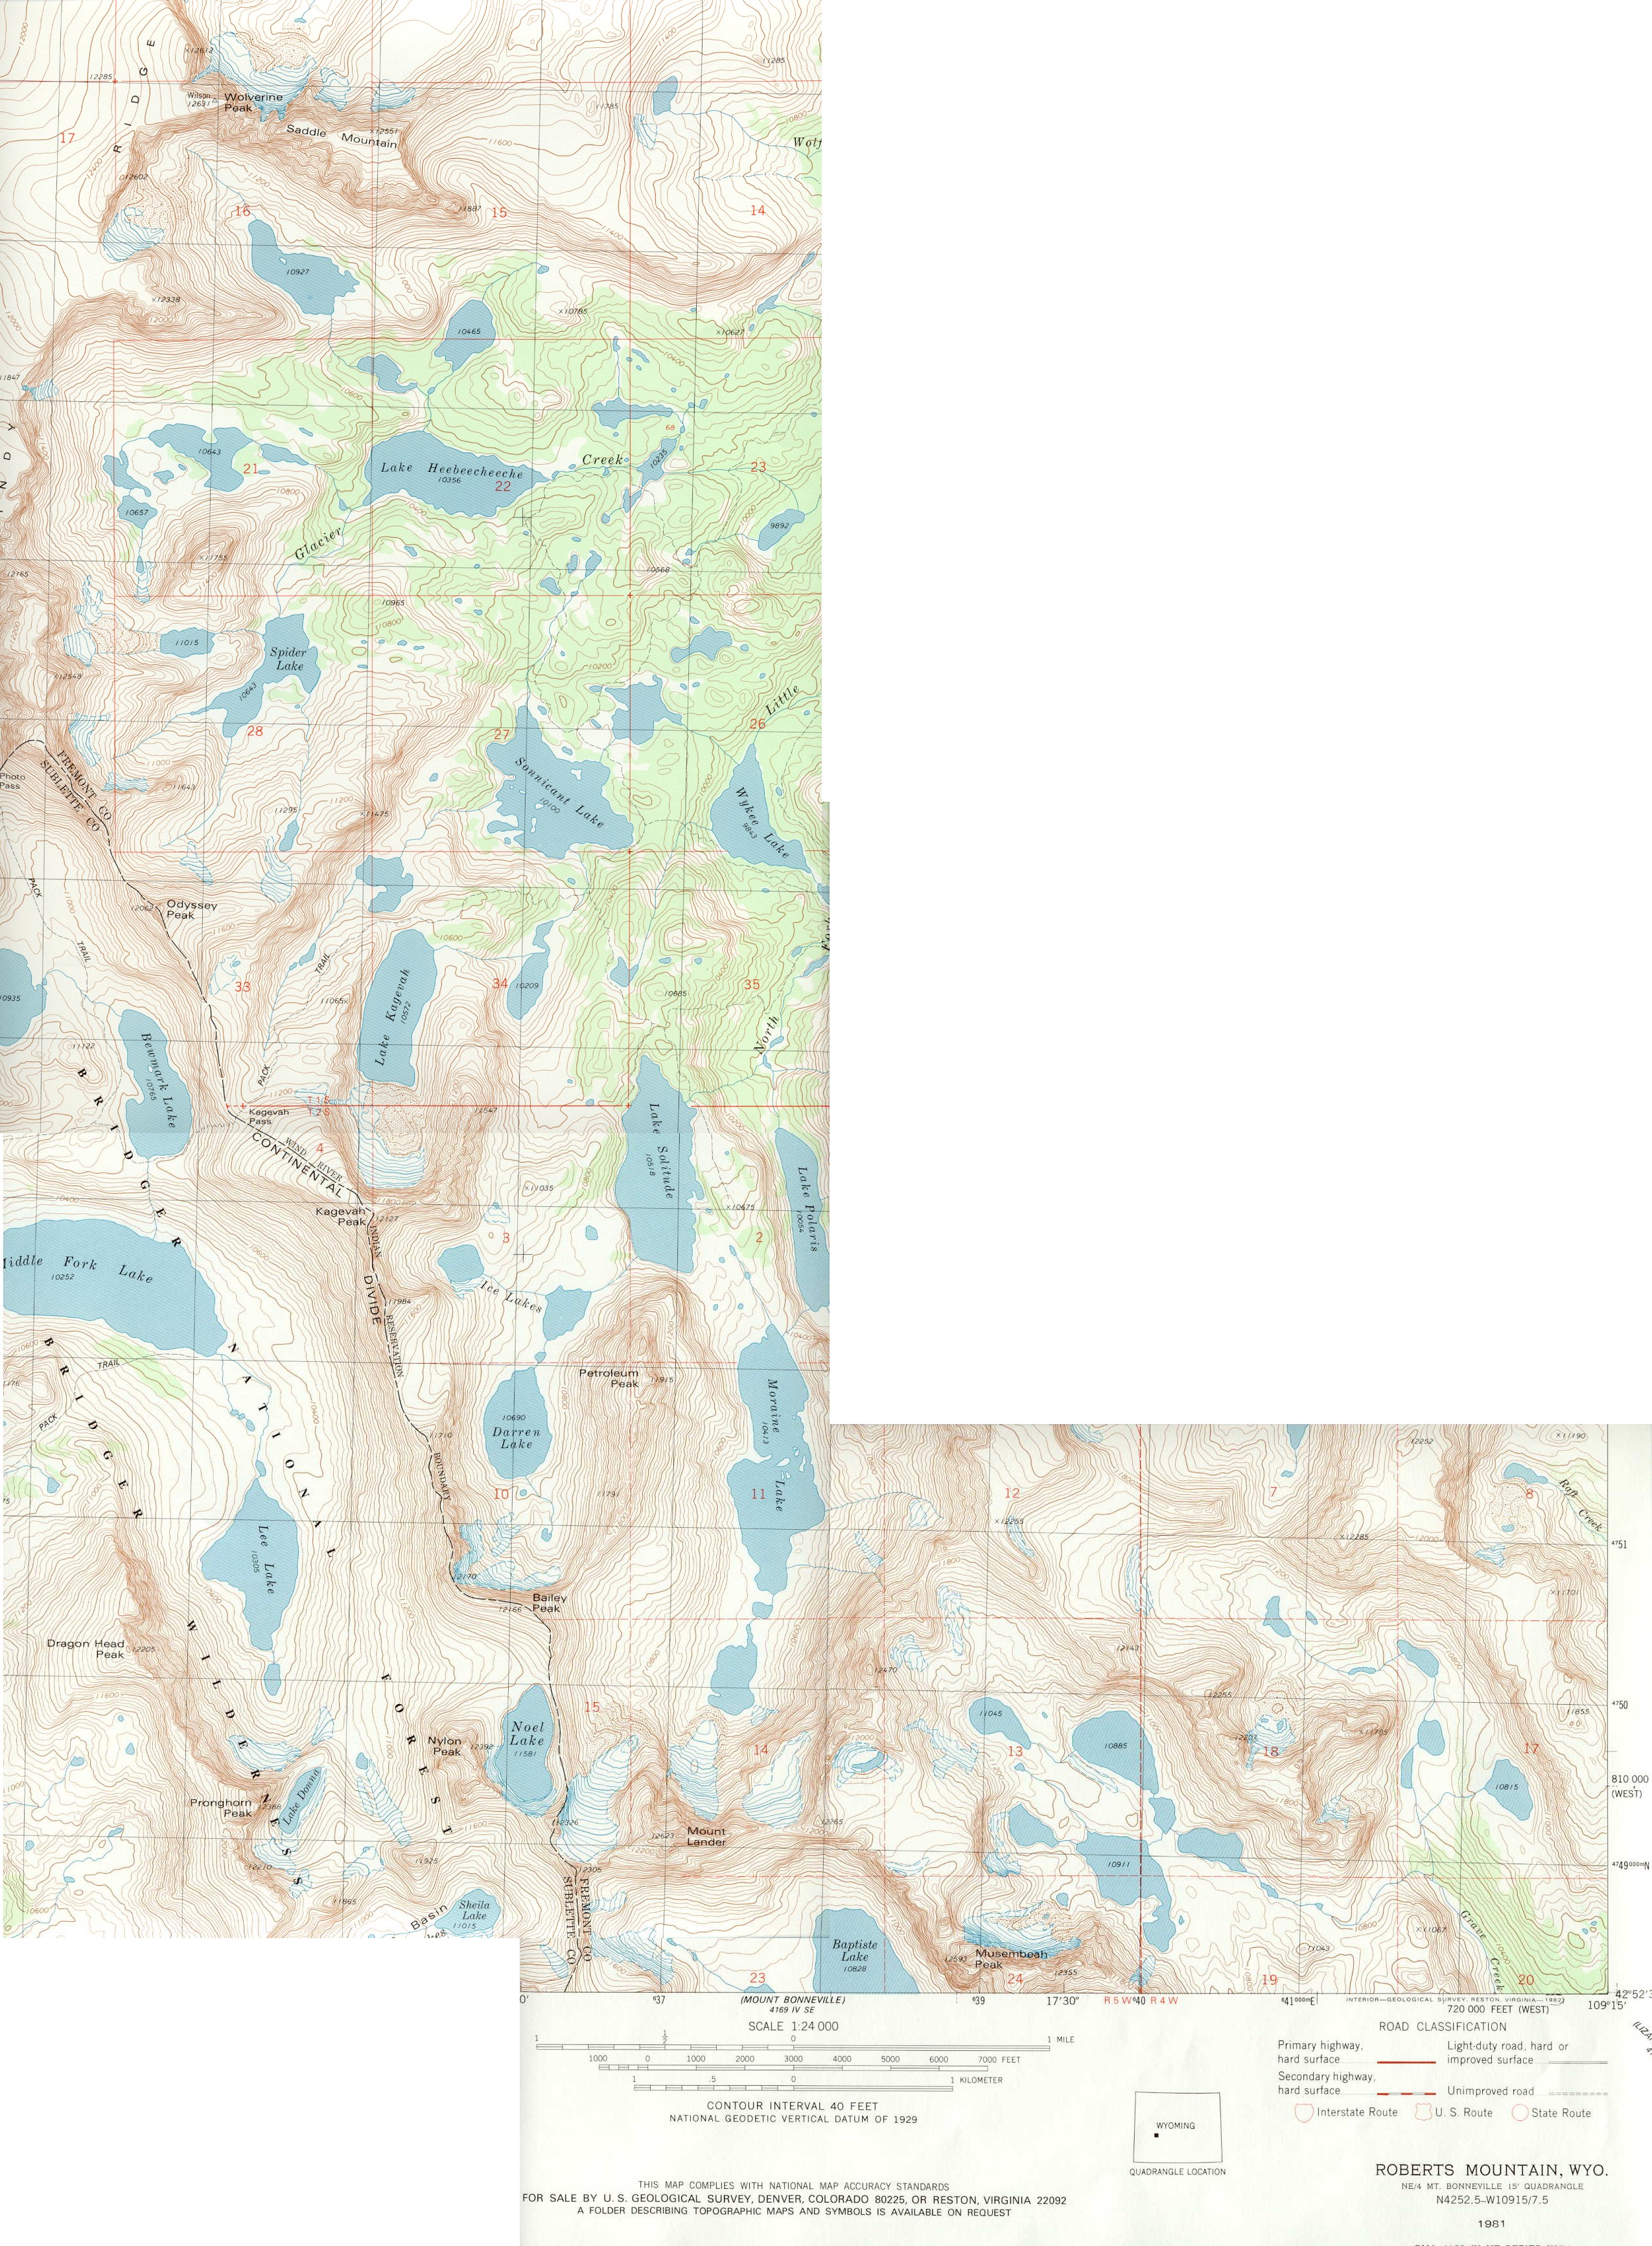
small scale map of Mount LoganWyoming: Wind River Range Roberts Mountain quadrangle
small scale map of Roberts Mountain
2. Choose 10 glaciers in each state (50 glaciers) that, in your opinion, roughly represent the spatial characteristics of the glaciers in that quadrangle. Spatial characteristics include area, orientation, elelvation, etc.
Make a table for each quadrangle (EXCEL can help here) and include the following columns of data in order:
Glacier
Minimum Maximum Average
Altitude Orientation
Name Altitude
Altitude Altitude Range
Not all glaciers will have a name, if not, please include the peak the glacier is on if possible. Calculate the average altitude from the average of the minimum and maximum altitude. The range is the difference between minimum and maximum. Estimate the orientation according to the 8 cardinal points of the compass (N, NE, E, etc)
Include the approximate latitude and longitude of the center of each quadrangle from which the glacier data has been collected.
3. Make 3 plots: a) the average altitude of all the glaciers for a north-south transect along the Pacific Coast (WA-OR); b) the same for the inland north-south inland transect (MT, WY, CO); c) a west to east transect (WA-MT).
Note, include in this plots
the range of each glacier. Use the plotting symbol
below. The solid circle is the average elevation and the bar represents
the maximum and minimum elevation range of the glacier.
![]()
4. Discuss the differences in these elevations according to variations in climate for each region. Consult the library and search the web for data to support your discussion of climate. Since there are no climate stations near the glaciers do the best you can with the climate data you acquire. Include in the discussion a section on orientation of the glaciers in each region. Can you figure out a way to plot that data?
5. FINAL PRODUCT: Turn in the results of steps 2, 3, and 4 in the form of a report. Outline the report as follow:
Introduction
Methods
Results
Discussion and Conclusions
-----------------------------------------------
You may work with others on the report, but your writing, figures, tables, etc, must be your one work.
The report will be typed in 12pt font, double spaced, and multiple pages stapled together.