|
Click here to read part 2 Problem - Counting and measuring the glaciers in a large area Alpine glaciers are important indicators of climate change and are natural reservoirs of fresh water. Thus tracking glacier size and population are important for monitoring the effects of global and regional climate change and the resulting impact on water resources in mountainous areas. Measuring glaciers can be difficult and expensive because many are located in remote areas where travel is complicated by rugged alpine terrains and adverse weather. This is particularly true in the North Cascades Range of Washington, where dense forests, steep slopes, and poor weather make foot travel slow and often rigorous. Furthermore, helicopter support is limited by flight regulations in wilderness areas and is highly weather dependent. One approach for tracking glacier change is to monitor a single, relatively accessible glacier in a region and treat it as representative member of the glaciers in the region. (c) In 1958, the United States Geological Survey (USGS) selected South Cascade Glacier, a valley glacier to the southwest of North Cascades National Park, to represent the North Cascades Range. (c) Each year ground crews makes detailed measurements of changes in its mass several times in the spring, summer, and autumn. Several aerial photographs of the glacier are also taken. The result is a nearly 50 year record of the size, shape, and dynamics of the glacier, one of the longest continuous detailed records of glacier change in the world. (c)
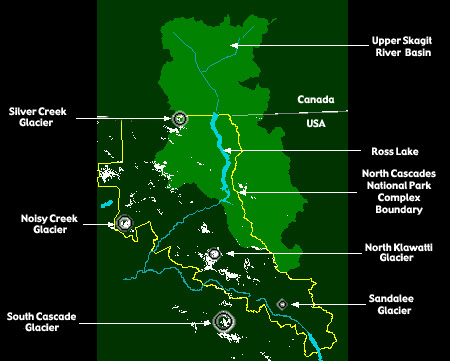
One obvious question is, how representative are the changes of South Cascade Glacier to glacier changes in the rest of the North Cascades? To help answer this question, in 1993, the United States National Park Service (NPS) began a glacier monitoring program within the North Cascades National Park Complex. They selected four glaciers of different size, type, and location to represent a wider cross section of the region's glacier population. Like the USGS program, they acquired yearly aerial photography and made ground based measurements of the changing glacier mass. (c) A similar program, conducted by the North Cascades Glacier Climate project has provided additional information by conducting mass change studies on forty-eight other glaciers spread throughout the North Cascades. (c)
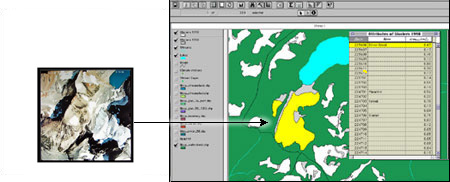
A different method for monitoring glaciers is to use aerial photography and satellite images to create digital maps of all the glaciers in a region. This kind of data is used in conjunction with historical photographs and historical maps to produce a time-lapse picture of changing glacier area. These maps do not provide the important details of the physical processes gained by ground-based measurements. However, they do provide a comprehensive portrait of area change for all the glaciers in the region that is both cost and time efficient to construct. This remote sensing /GIS approach was recently used by us (c) to create maps showing glaciers of the North Cascades National Park Complex for both 1958 and 1998. This group of glaciers includes nearly 80% of the glaciers in the Upper Skagit River Basin.
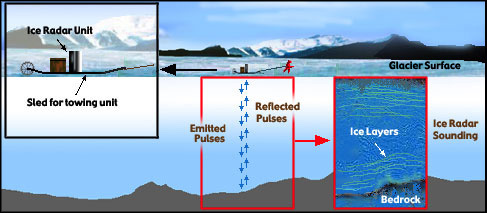
Problem - Estimating the volume of a glacier To estimate the volume of water stored as ice in a glacier (important to know for estimating total amount of available water) we need to know the area and thickness of the glacier. The area is easily obtained from a map based on aerial photographs, satellite images, or ground surveys. Thickness, however, is a bit more difficult. There are several direct ways of measuring glacier volume. The most obvious method is to drill through the glacier. But, this is time intensive and glaciers can be quite thick; a "small" glacier can be 100 meters (328 feet) thick. Furthermore, you have to drill lots of holes to obtain enough measurements to map the altitude of the bottom of the glacier. Another method is to use ice penetrating radar. Like ground penetrating radar used for searching for buried metal containers of hazardous waste or archeological artifacts, ice radar emits a pulse of energy at radar frequencies that is transmitted through the ice and reflected off the bottom of the glacier. The time of travel for the radar pulse from the emitter back to the receiver depends on the distance to the bottom of the ice. As the ice radar unit is towed over the surface of a glacier it is constantly determining the thickness of the ice, in much the same way that a nautical sounder on a boat determines the depth of the water underneath it. The glacier volume is calculated from the average thickness and area of the glacier.
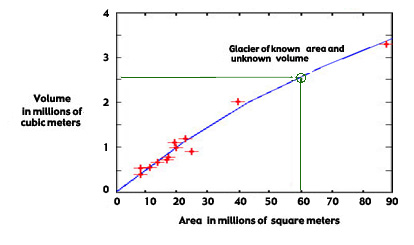
Ice radar is probably the most direct and accurate way of measuring glacier volume and, hence, volume change. But like any ground-based method, it is relatively slow and subject to weather conditions. Also, this method can only be applied where foot travel is relatively easy, and where smooth glaciers have low slopes and few crevasses. Currently, no glacier thicknesses in the Upper Skagit Basin have been measured due to the expense and time required for doing radar surveys. One approach to overcoming this difficulty is to estimate a glacier's volume from its area by plotting one against another (see Figure 5). This technique, know as area-volume scaling, relies on the simple idea that bigger glaciers have more volume. (c)
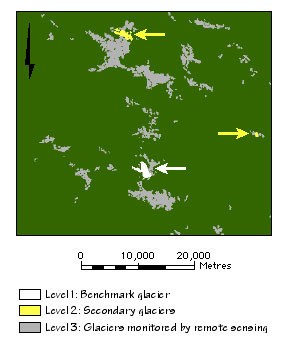
Problem - Monitoring changes in the number and size of a group of glaciers Each method for assessing glacier change has its own advantages and disadvantages so different methods are used for different purposes. Although we (c) have relied on the remote sensing approach to provide an overview of glacier change in the Upper Skagit River watershed, the most effective approach for monitoring glacier change is to use ground-based measurements, along with aerial photography and satellite images. Using a combination of methods makes up for the limitations of any single method, improves our understanding of the physical processes of glacier change, and provides a sense of glacier change over a broad area. (c) The first tier of this approach is to monitor, in detail, a single "benchmark" glacier. In the North Cascades region, the mass balance, stream flow, and the climate of South Cascade Glacier, the region's benchmark glacier, are all monitored each year . In the second tier, a small group of "secondary" glaciers are chosen for study of detailed glacier mass changes around the regions. Unlike the benchmark glacier, streamflow and climate at these glaciers are not studied. The U.S. National Park Service monitors four such glaciers (Silver Creek, North Klawatti, Noisy Creek, and Sandalee Glaciers). Finally, in the third tier, a still larger group of glaciers is monitored using only aerial photography and satellite images to estimate changes in glacier area. This effort was carried out by Portland State University in cooperation with the National Park Service. (c) While field methods provide the most accurate glacier areas and volume, the expense and difficulty of frequent field work limit the number of glaciers that can be continuously monitored. On the other hand, monitoring glaciers with remote sensing imagery and digital mapping technology significantly increases the number of glaciers that can be mapped but do not provide the detail required to understand the physical processes.
|