|
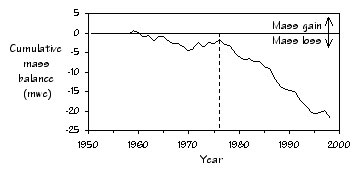
Problem - Finding the link between climate change and glacier change Once it is established that glaciers in a region have changed, the next task is to determine why they changed. One way to address this question is to match rates of glacier mass loss or gain (mass balance) with changes in local climate. This is done by comparing each glacier's yearly mass balance to its local climate, average annual air temperature and winter precipitation. Melting depends on air temperature, while snow accumulation depends on winter precipitation. (c) In practice this is complicated by several problems. First, climate data in mountainous areas is quite limited. Most of weather measurements are collected at low altitudes that are far below the glaciers. Second, detailed glacier mass balance is available for only a few glaciers in each glacier region. To deal with the last problem first, changes in glacier area and volume between 1958 and 1998 have been calculated for approximately 80% of the glaciers of the Upper Skagit River Basin. The majority of these glaciers shrank. Since the regional benchmark, South Cascade Glacier, also lost mass between 1958 and 1998, we assume that its mass balance record can be used to represent yearly mass changes for most of the glaciers of the Upper Skagit Basin. Therefore most of the glaciers of the Upper Skagit Basin had more years where they lost mass, than they had years where they gained. Furthermore, most of the mass they lost between 1958 and 1999 was lost between 1976 and 1998.
Climate may vary somewhat between glacier, but broadly speaking the seasonal climatic variations and the year to year differences in climate are roughly the same between glaciers. In a similar sense, if Everett, WA. has a year that is colder and wetter than average, so will Seattle, WA., although how much colder and how much wetter might be somewhat different in each city. To smooth out the small climatic differences between weather stations and to estimate the climate over broad regions, we used "Climate Division" data. These data are sophisticated averages of the data from each weather station, and they also account for topographic influences in the region. These data are calculated by climatologists and available from the Western Regional Climate Center web site at <http://www.wrcc.dri.edu/climsum.html>. In the Upper Skagit River Basin, there are two divisions, Cascade West and Cascade Foothills. Most of the basin is in the Cascade West Division. We obtained climate division data for year temperature and yearly total precipitation. Figure 2 shows that between 1958 and 1998 overall annual temperature increased by nearly 2°C, while precipitation increased slightly. This suggests that the increase in air temperature, rather than precipitation caused shrinkage in the glacier cover in the Upper Skagit Basin. 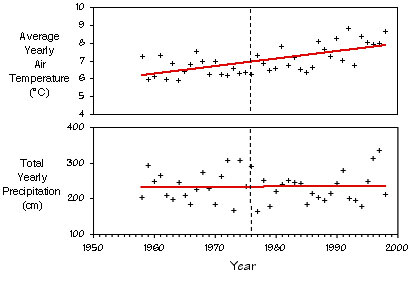
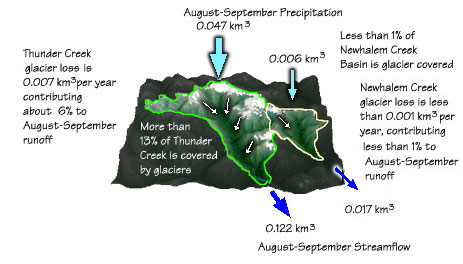
So what caused the accelerated glacier mass loss after 1976? A closer look at the divisional data showed that winters after 1976 tended to be drier and warmer than those before 1977, optimal conditions for glacier mass. (c) Problem - Finding the impact of glacier change on streamflow Glaciers are reservoirs that store water during periods of heavy snowfall and release it during warmer, drier times of the years. (c) So it is logical to assume that as the size of these glacial reservoirs changes, so too should their contribution to streamflow. The problem is determining how their contribution changes as the sizes of the glaciers change. Two watersheds that can shed light on this question are located immediately to the west of the Upper Skagit River Basin, Thunder Creek and Newhalem Creek. Unlike the watersheds in the Upper Skagit Basin, these two basins have extensive streamflow, climate, and glacier data. Fortunately, they are close enough to the Upper Skagit, that our conclusions apply. To compare the two basins we did the following:
Most of glacier mass loss in the North Cascades occurs during the two driest months of the year, August and September. Because this is when the extra water is needed to maintain stream flows, it is particularly important to determine the percent of August-September runoff provided by glacier mass loss. By selecting two watersheds that have different percentages of glacier cover, we can get a glimpse how decreasing glacier cover reduces dry season runoff.
. |